Introduction
Alright, time to get down to some serious business. From this point forward, all of my blog posts will be in support of my master’s degree capstone. I may be a little less chatty than I normally am for a while as my main focus is just getting these rolled out in a timely fashion. These posts will still go over what we’re deploying and how we’re doing it and there’s going to be a little more information on things like version numbers and any issues we run into or anything during deployment. I’m not quite going to get into what my capstone is right now, I may do that later either after everything’s already out or just when I have time. Today though, we’re deploying Security Onion, which if you’re not familiar, is an free and open SIEM solution and network monitoring suite. It’s built on the Elastic Stack and comes prepackaged with several security tools that we’ll like to have. We’ll be spinning it up on Proxmox version:
pve-manager/9.2.2/b9984c6d90a4bd80 (running kernel: 7.0.2-6-pve)
We’ll also have SPAN running from our OPNsense box (OPNsense 26.1.11_10-amd64) to our Proxmox box which will be fed into Security Onion so we have network visibility, which will be important later. Okay, so with all that being said, let’s get rocking and rolling.
Creating a New Security Onion VM in Proxmox
Now, I know I never went over installing Proxmox at any point in the past, but this is a pretty minimally configured deployment at this point. I’ll leave a link to a great series on installing and doing some initial configuring of Proxmox here.
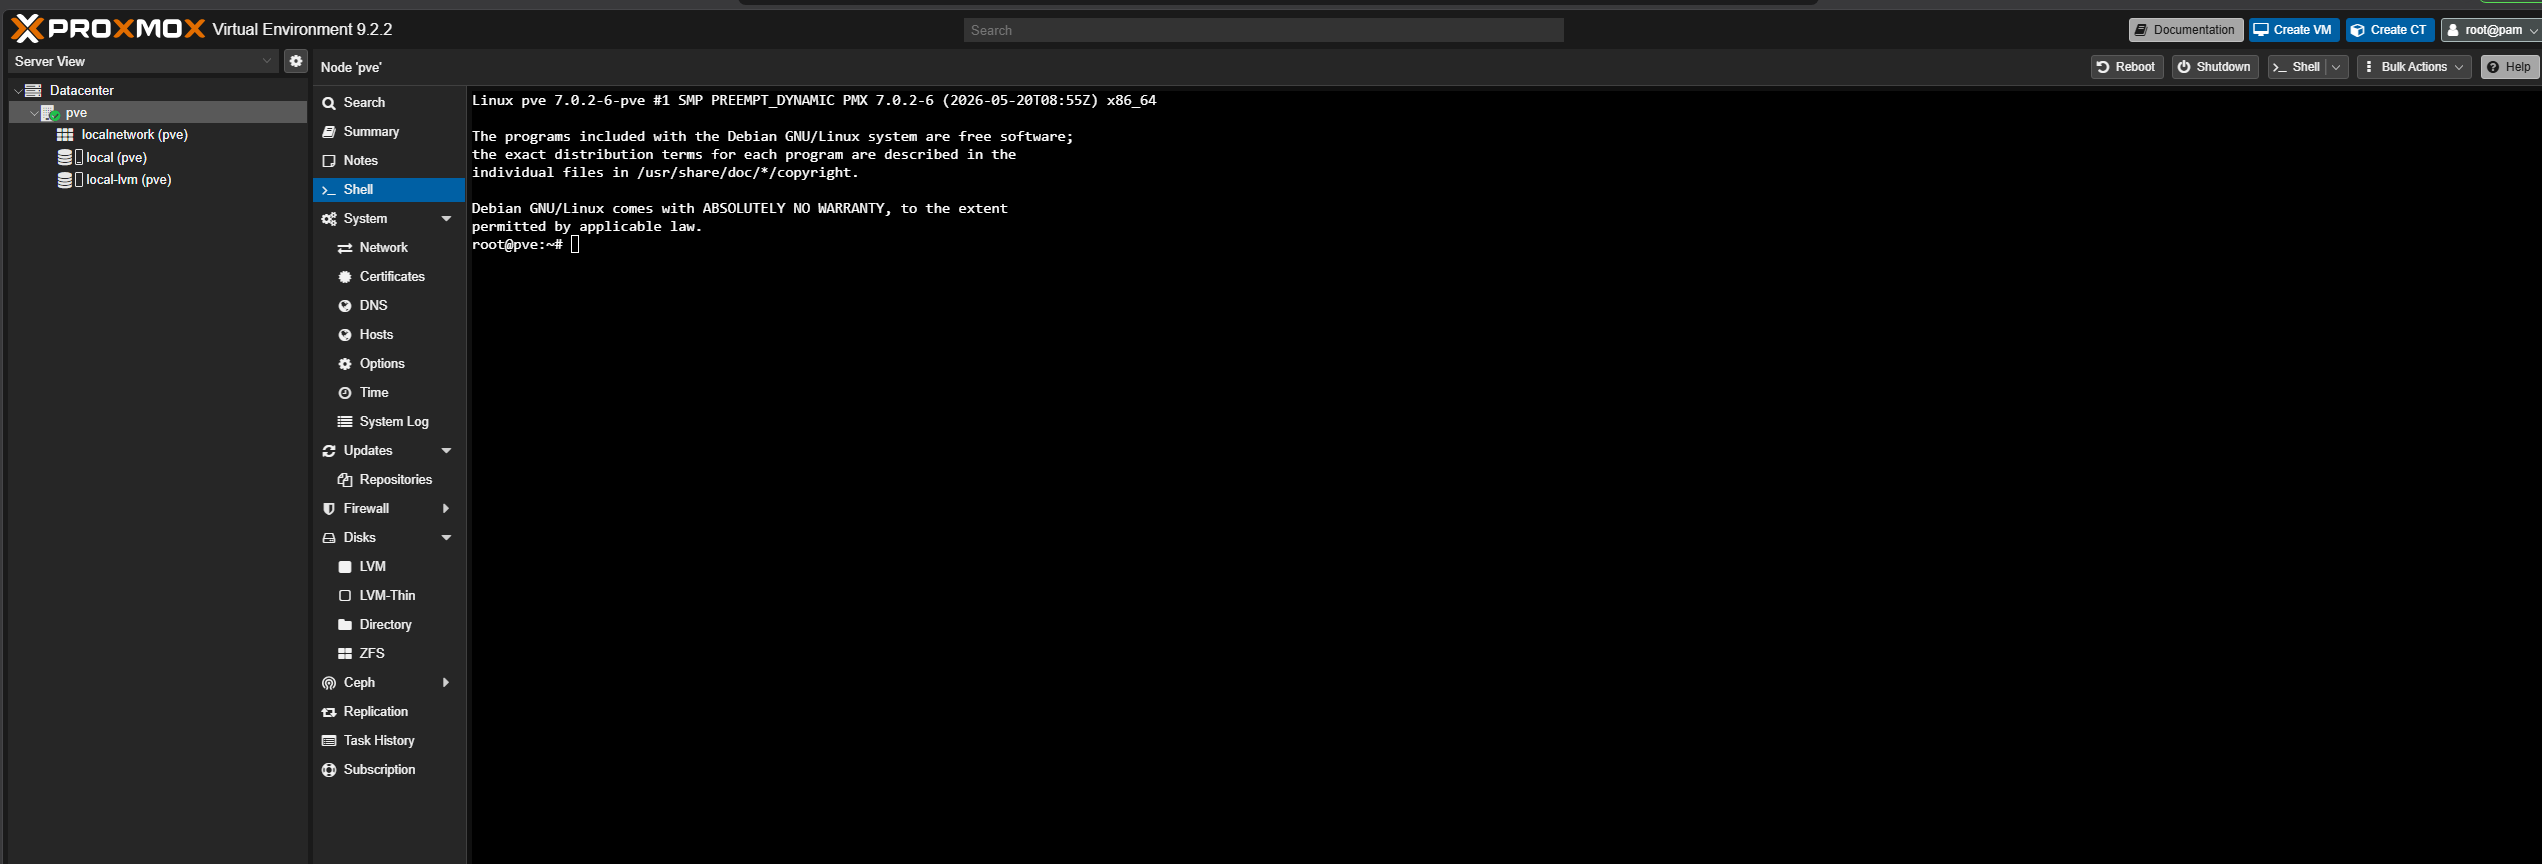 So after logging in we see the CLI of our Proxmox node. I haven’t set up any VMs yet, so you won’t see any on the left hand side there. As we want to deploy Security Onion as a VM, we’re going to want in the top right corner…
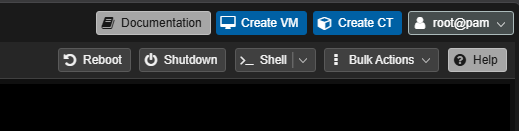 And click Create VM.
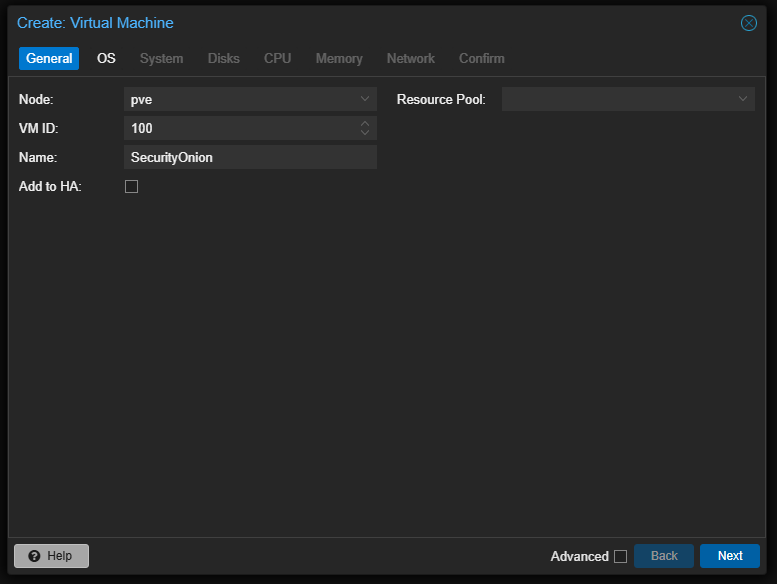 So here we just fill out some general info (VM ID and name). Next.
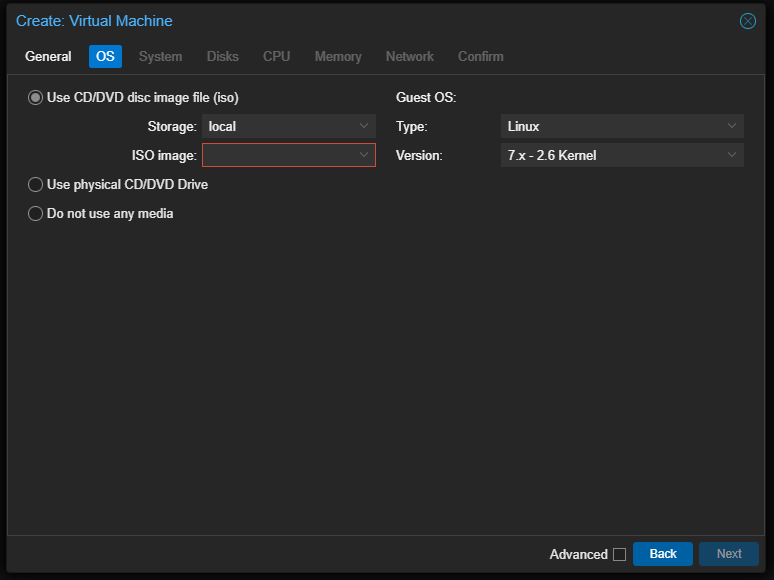 Actually, we’re going to need to download the Security Onion ISO file first. Here’s the link. No need to download it through your browser, we’ll do it through Proxmox itself.
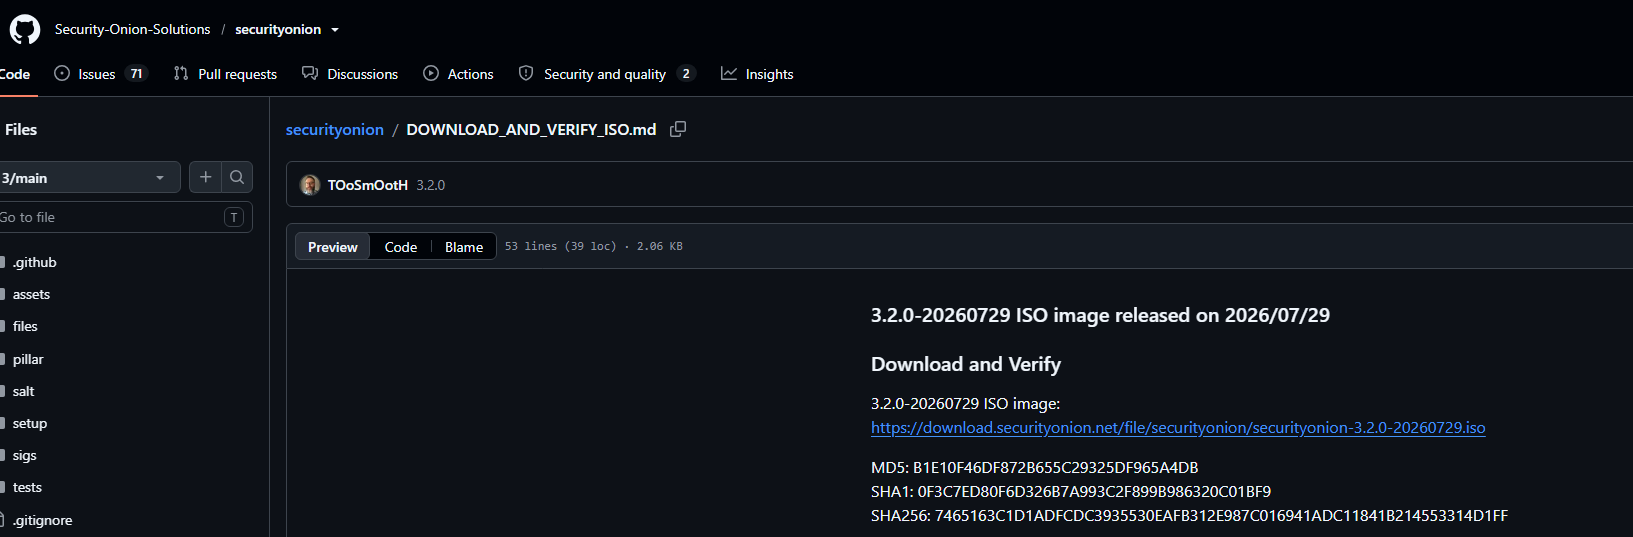 This will be Security Onion version: 3.2.0-20260729
Alright, let’s download this ISO through Proxmox.
This will be Security Onion version: 3.2.0-20260729
Alright, let’s download this ISO through Proxmox.
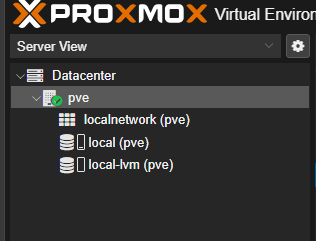 Under our node (pve in my case), click on the storage pool. I have two so I’m going to choose the non-LVM storage
 local (pve).
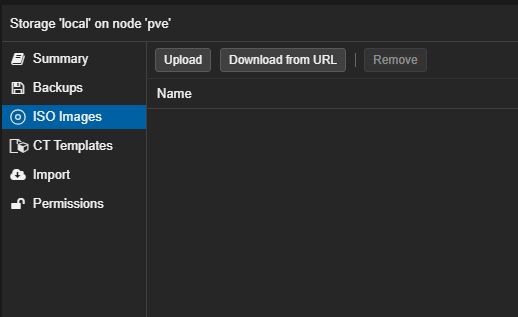 Go to ISO images. Now if we had the ISO on our local host we could upload it through here, but we’re going to Download from URL.
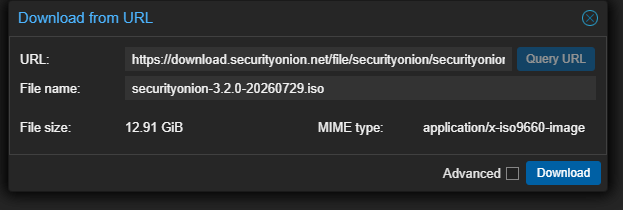 Paste the download URL in there, hit Download and we’ll wait just a little bit.
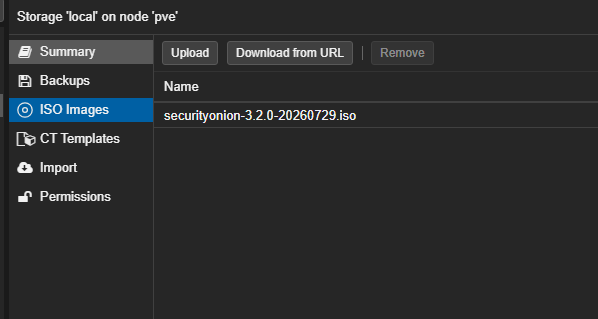 Alright cool, that’s all done. We can quick verify the checksum to make sure the ISO downloaded properly. You can either click the Advanced box when downloading the ISO and check the option to get the file hash after it’s done downloading or run the below command from the Proxmox CLI.

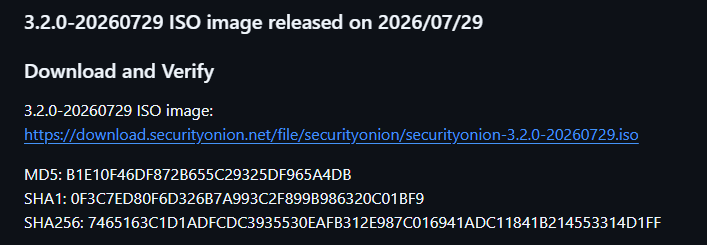 Alright cool, the SHA256 checksums match, so we’re looking good. Let’s pick up where we left on when we were creating the VM.
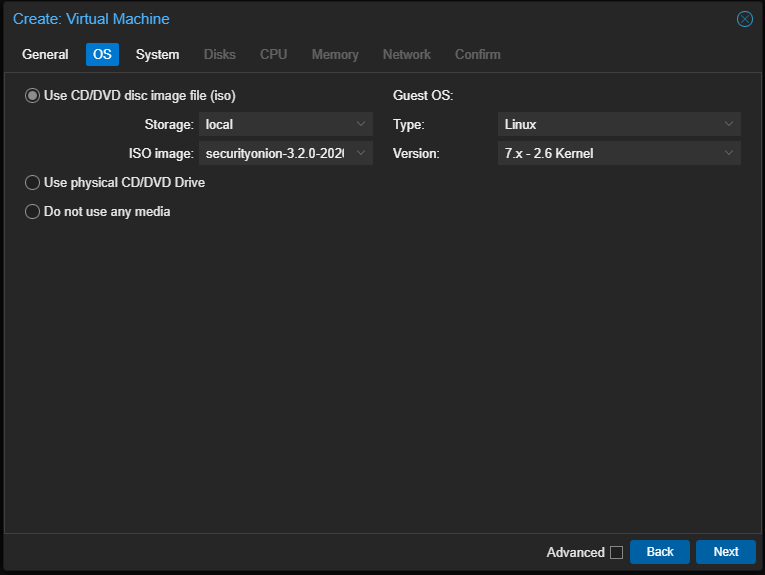 Choose our ISO from the dropdown menu and hit Next.
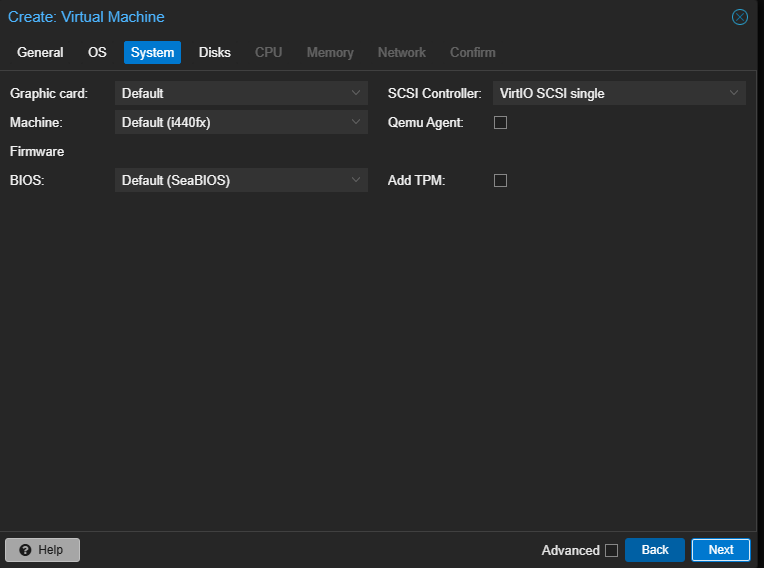 Defaults here should be fine. Next.
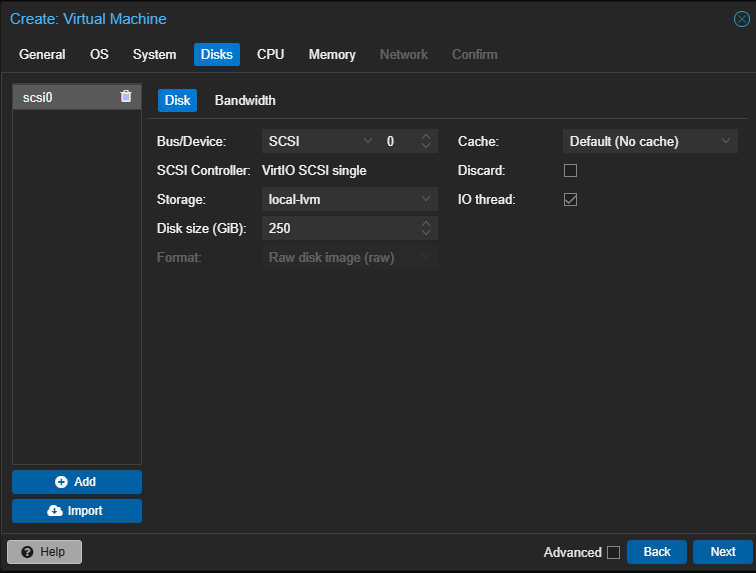 Set disk size to 250GB. Minimum 200GB per the documentation, so we’ll do a little extra. Next
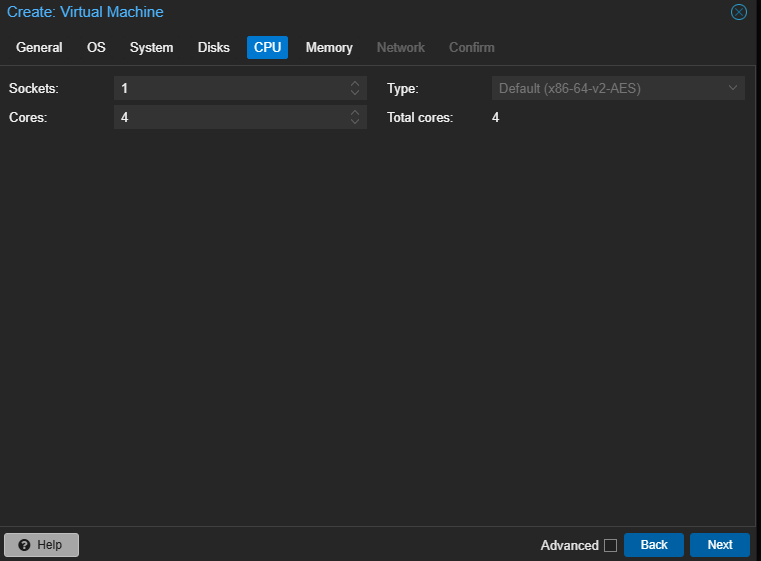 Imma do 4 cores, which is also the minimum per the documentation.
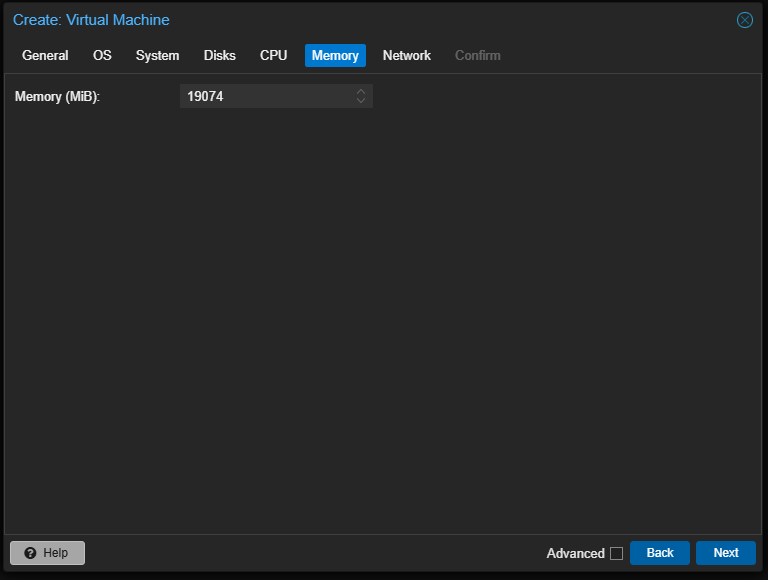 Now here with memory I’m being a little naughty. That’s only 20(ish)GB, whereas 24GB is the minimum for a standalone deployment. This could seriously bite me later, as we’re doing network capture through SPAN and using Elastic Agent for host visibility. I may add more later if I need it, but we’re going to see what I can get away with.
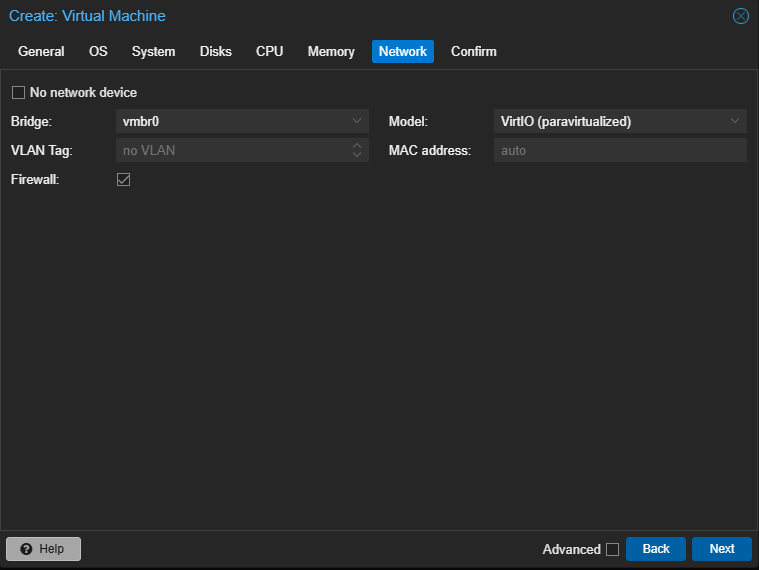 This all is fine for now, next.
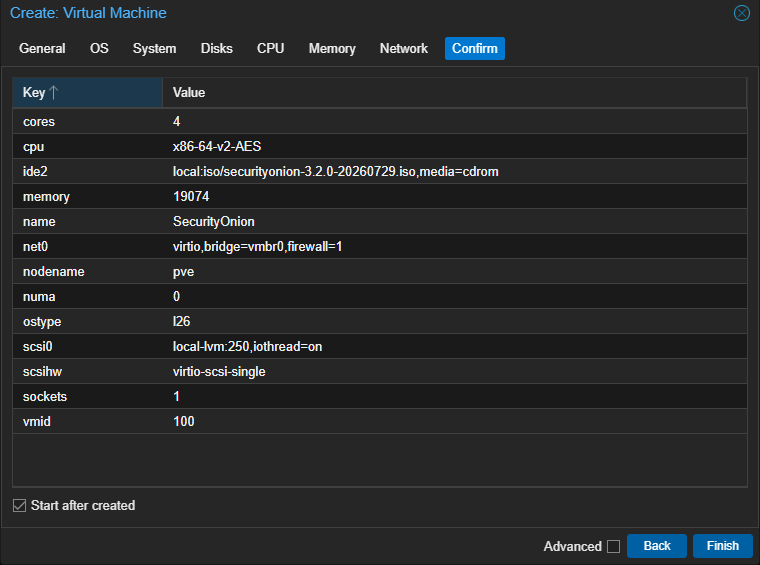 Make sure to review this to double check all of your configurations. This looks good to me. Let’s check for Start after created and then Finish. Give it a few minutes and then…
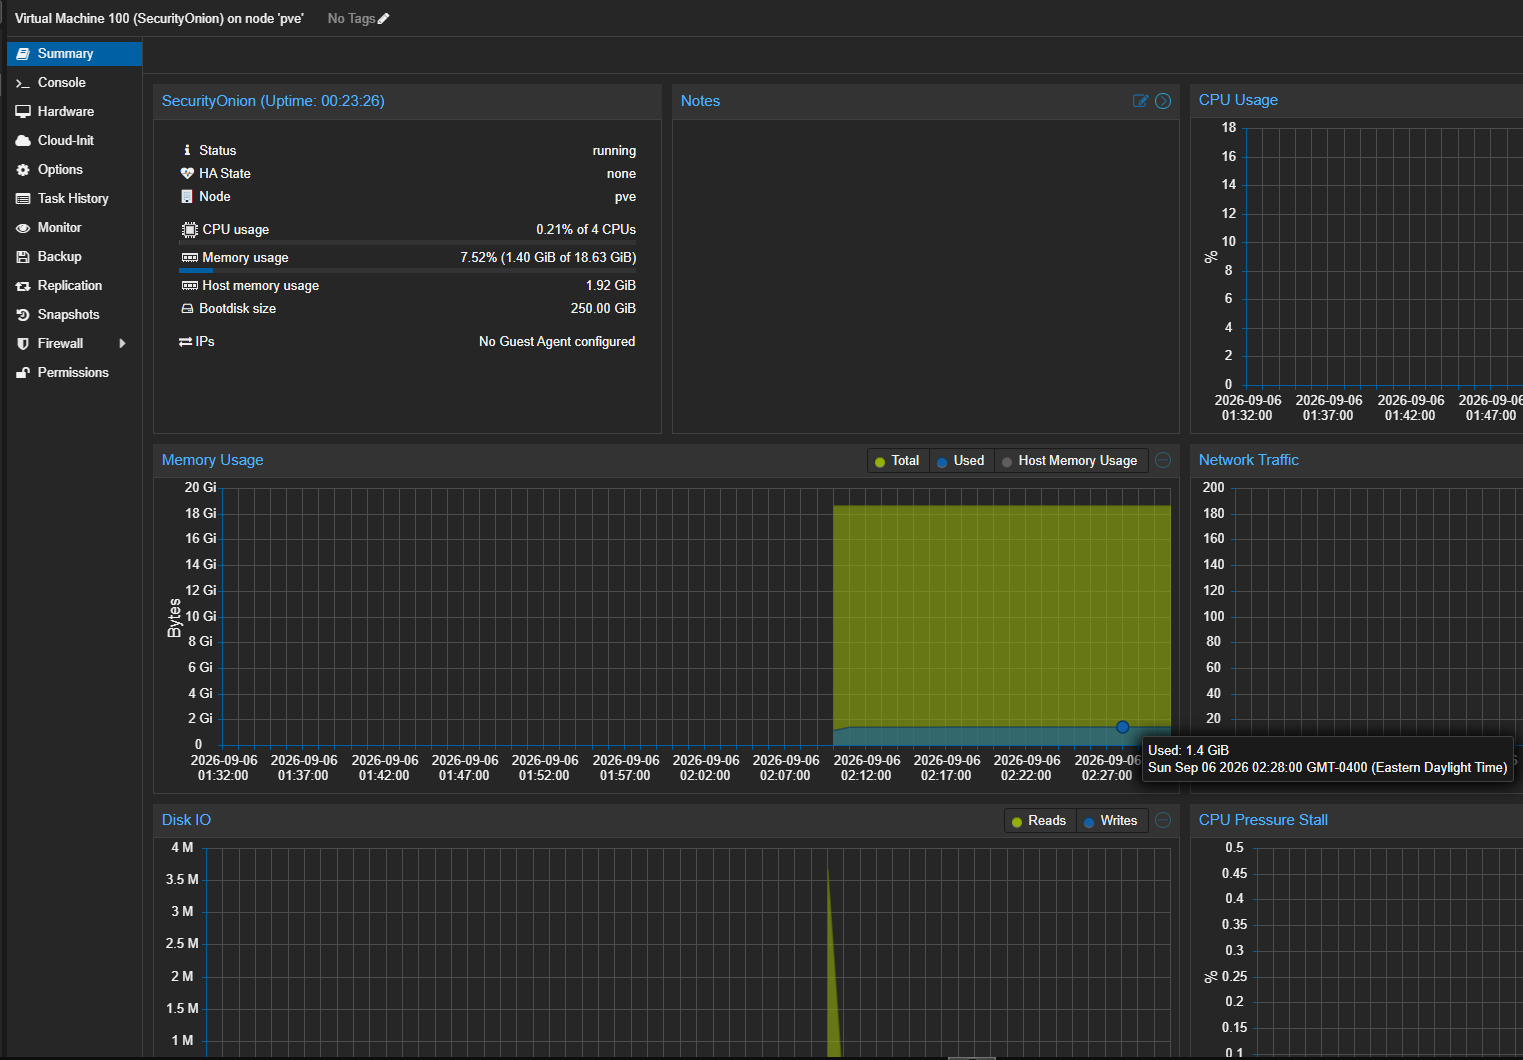 Our Security Onion VM should pop up on the left hand side and you can click on it. We start seeing statistics for it and that’s cool. Okay, again on the left hand side there, click on Console to get access to the CLI.
Installing Security Onion
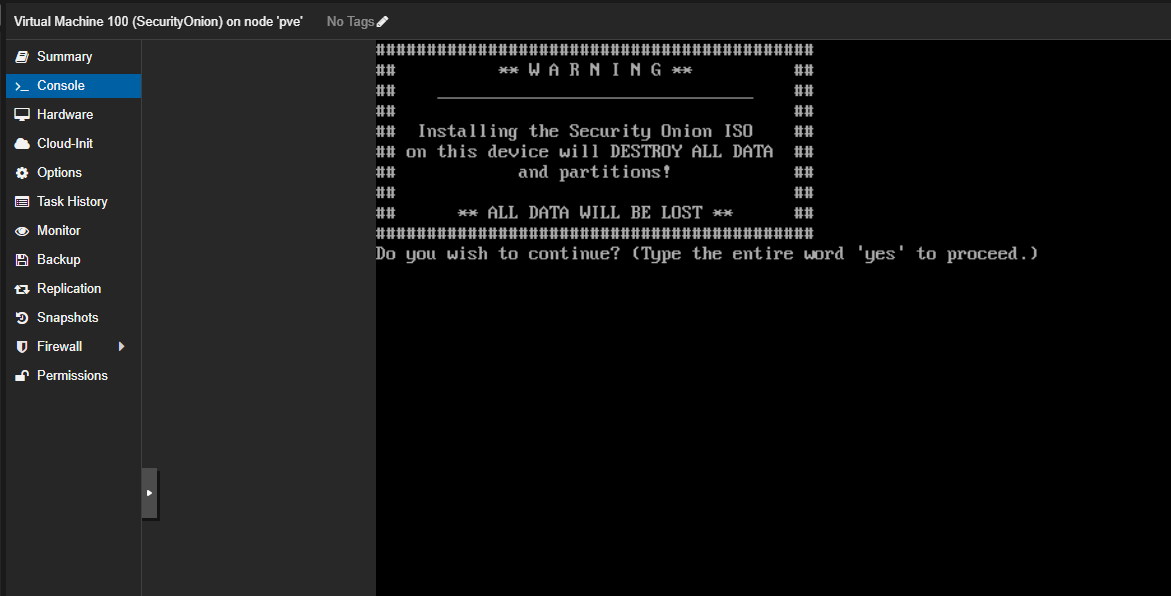 Amazing. Alright, type yes to get started with our install.
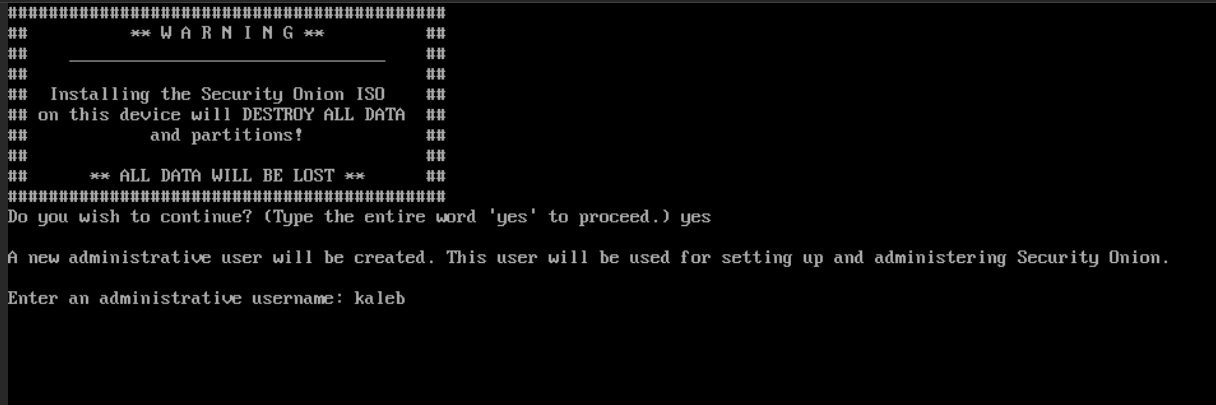 We get asked to make a new administrative user and will also ask for a password. After you do that, there will be some additional installations happening in the background. After that all finishes up though.
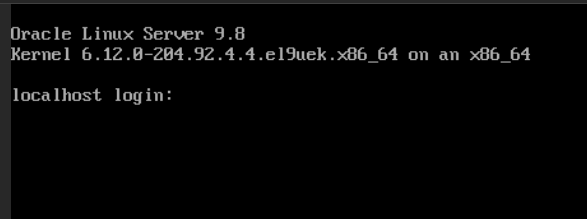 Cool, log in with your credentials.
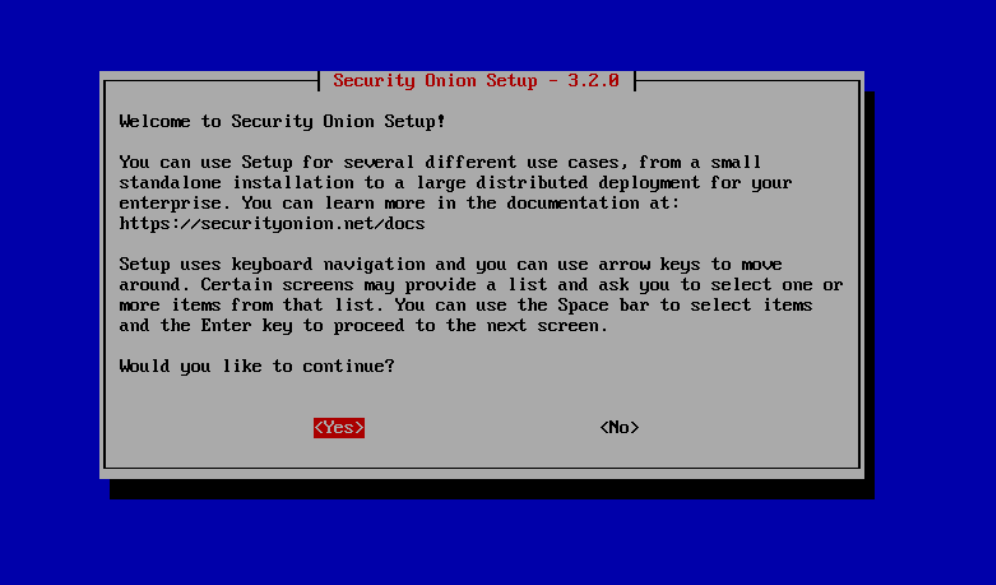 Awesome. Now believe it or not, we’re actually going to power the VM down real quick so we can do one more step.
Configuring our SPAN Port and Adding it to Proxmox
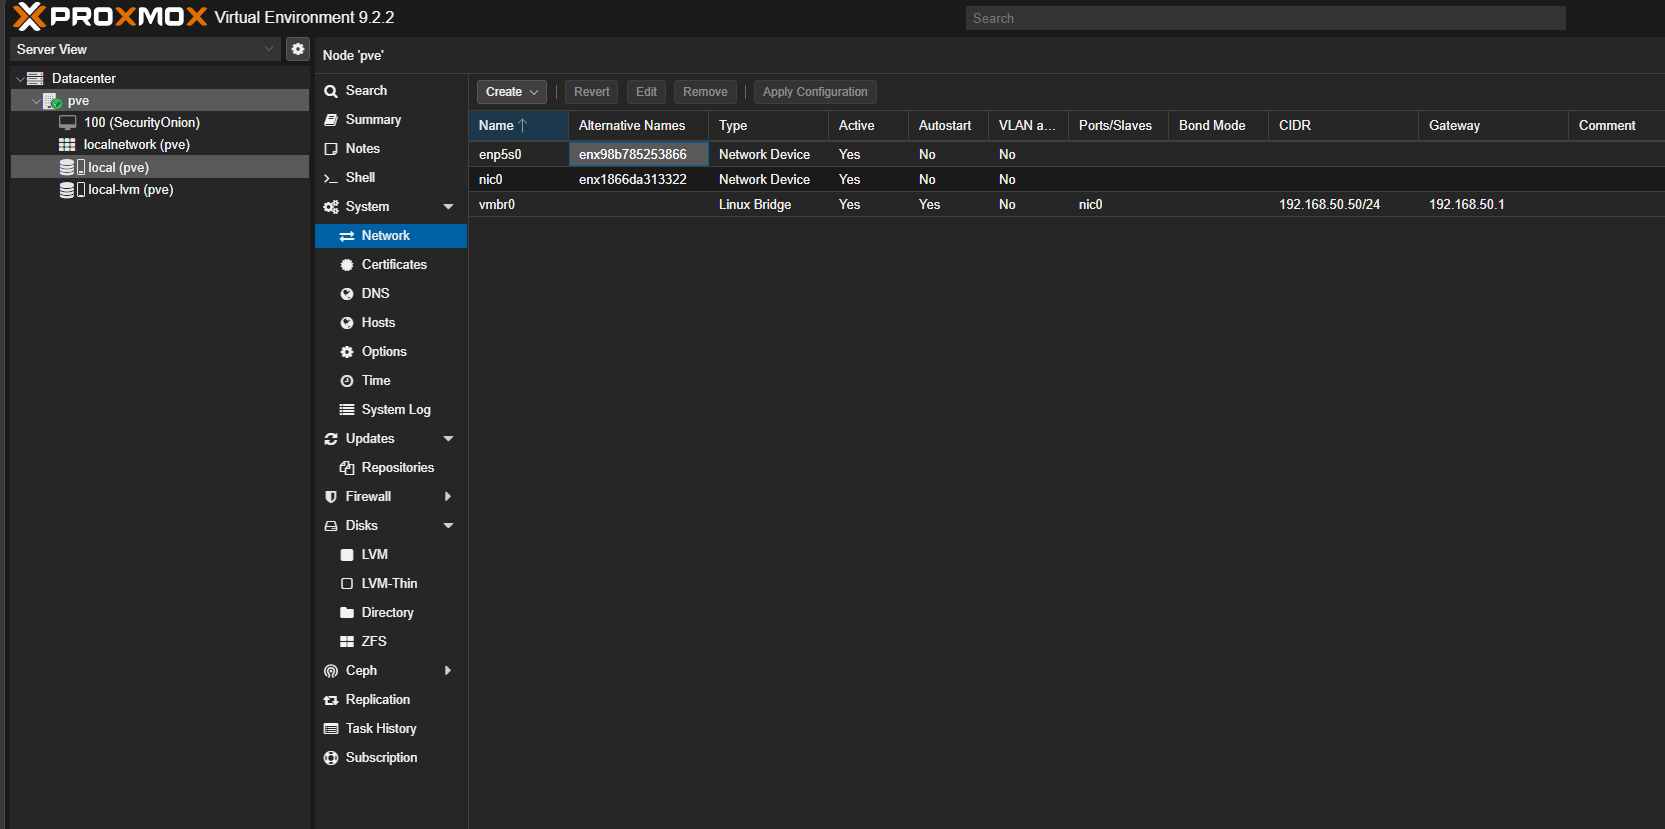 After the VM powers down, go back to our pve node and click on Network. We’re going to create a new network interface, so click on Create and then Linux Bridge.
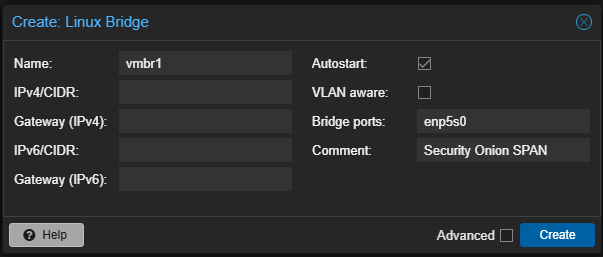 Name the interface and set which physical interface it’s bridging under the
 Bridge ports setting and then we put a comment for the interface. We don’t give it any kind of addressing information as this is a SPAN port. Click Create.
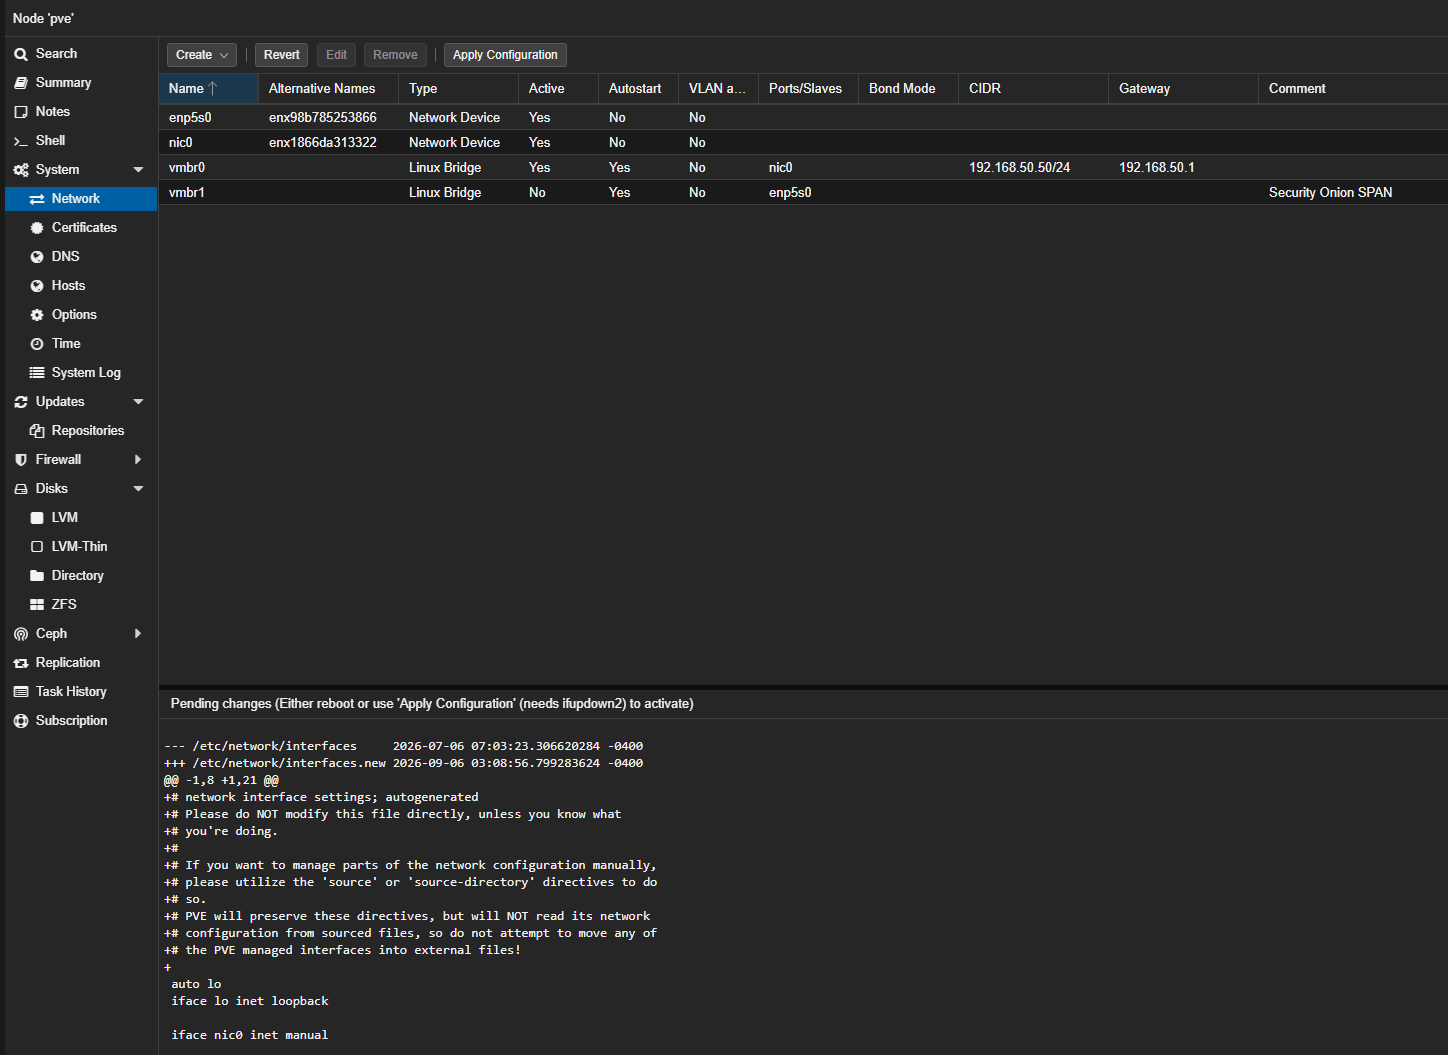 Looking good. Make sure to hit Apply Configuration at the top. After that saves, we’re heading back to our Security Onion VM.
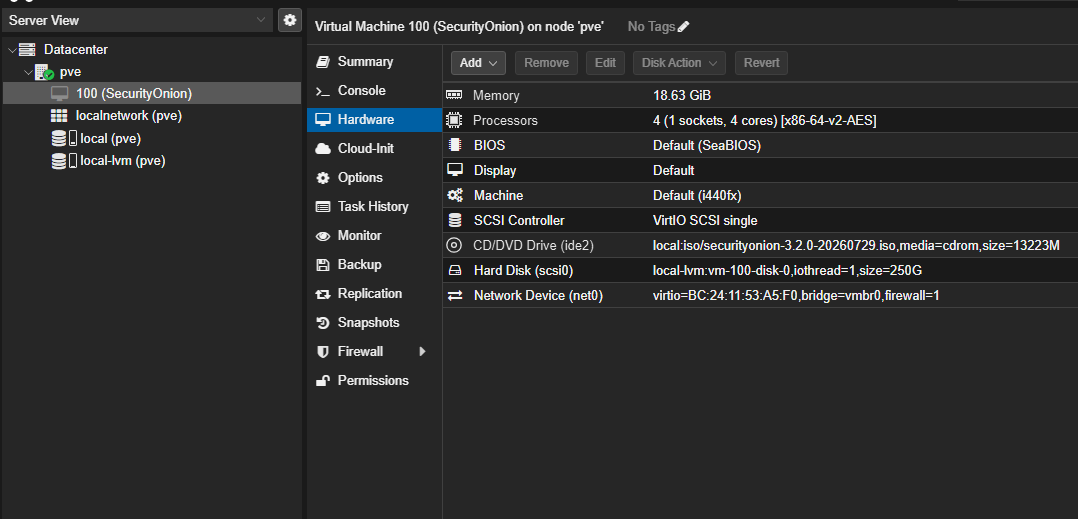 Okay, so under your VM if we go into Hardware we can see all the stats of our machine. I actually gotta make two changes, I gotta up the memory to exactly 20GB. But we also need to add our new network interface to this VM. So click on Add -> Network Device.
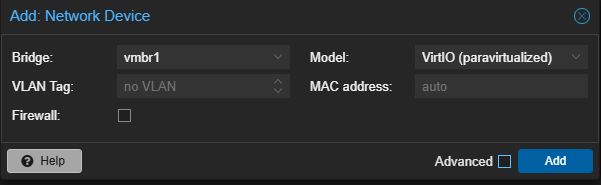 Uncheck Firewall, but the rest should be good. Add.
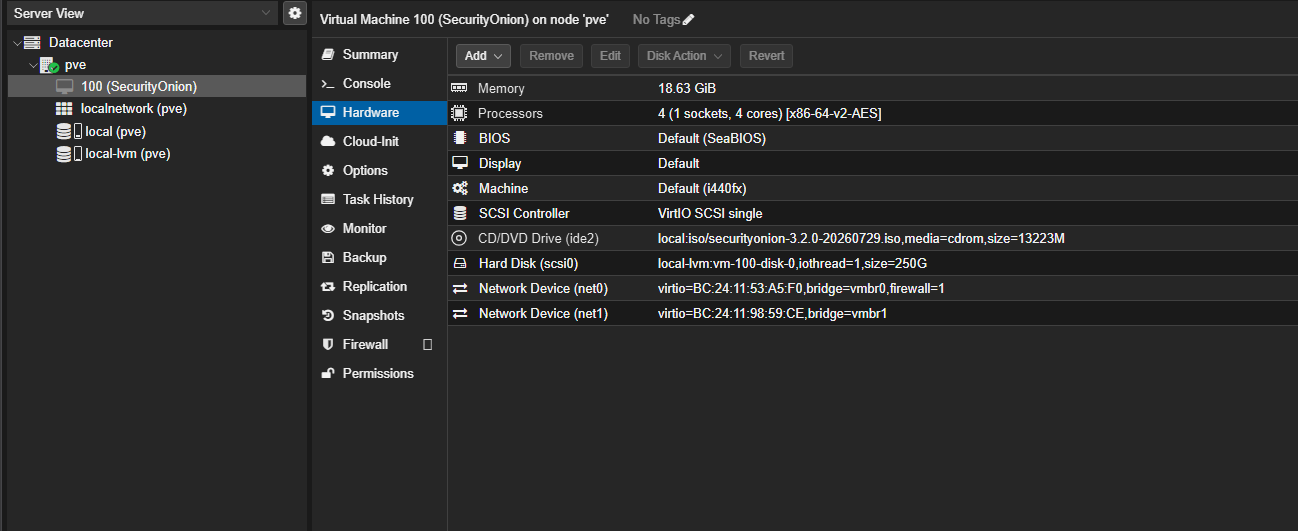 And our VM Hardware config should look something like this now. Now we’re going to head back over to our OPNsense box to configure the SPAN port there.
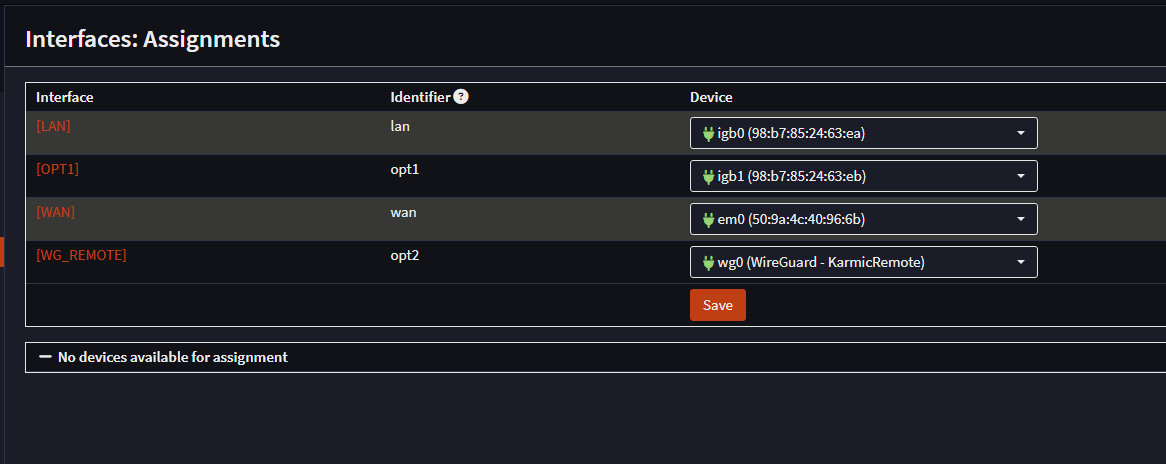 Under Interfaces -> Assignments, I have a spare interface (OPT1) that we’ll configure to be our SPAN port. Now we’re going to click on the interface.
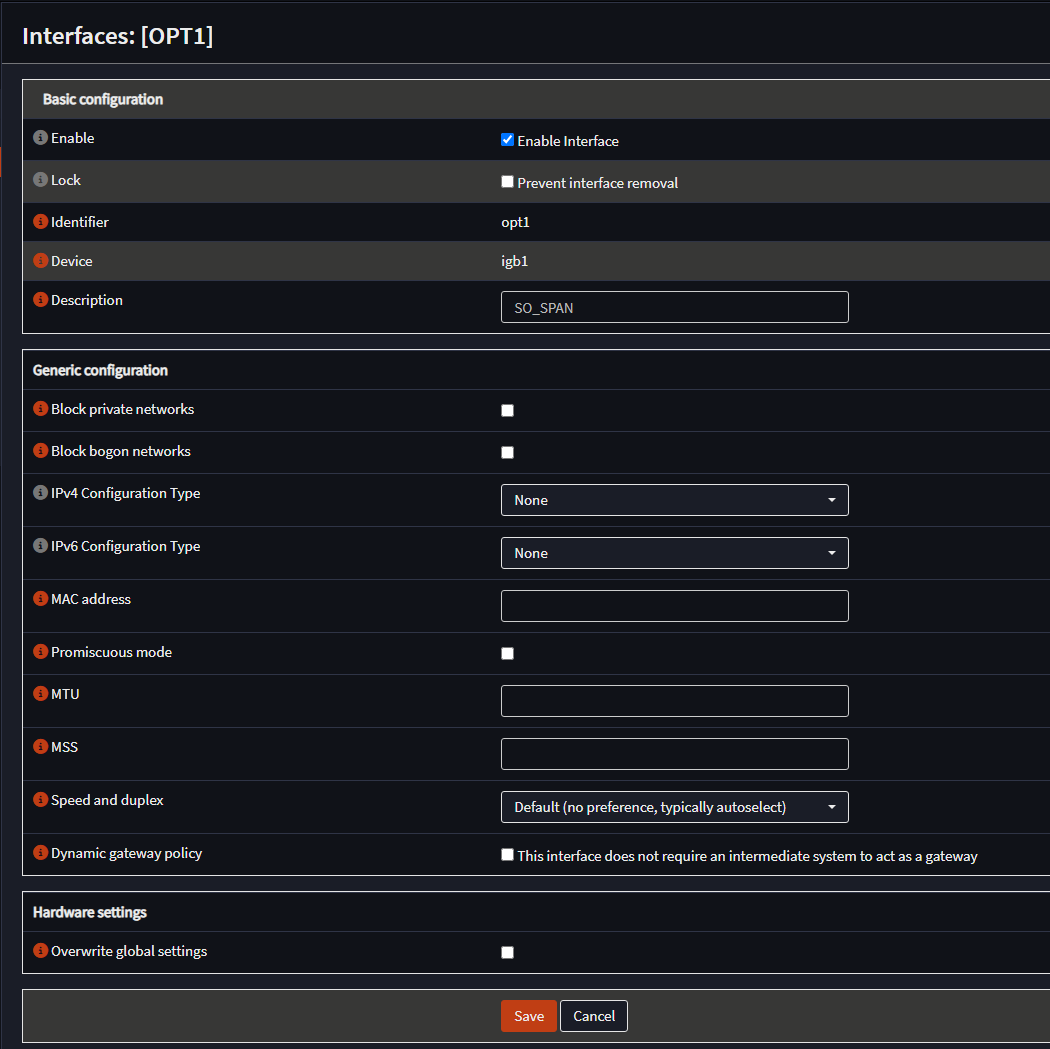 Really the only thing we’re doing here is adding a description, leave everything else blank or default.
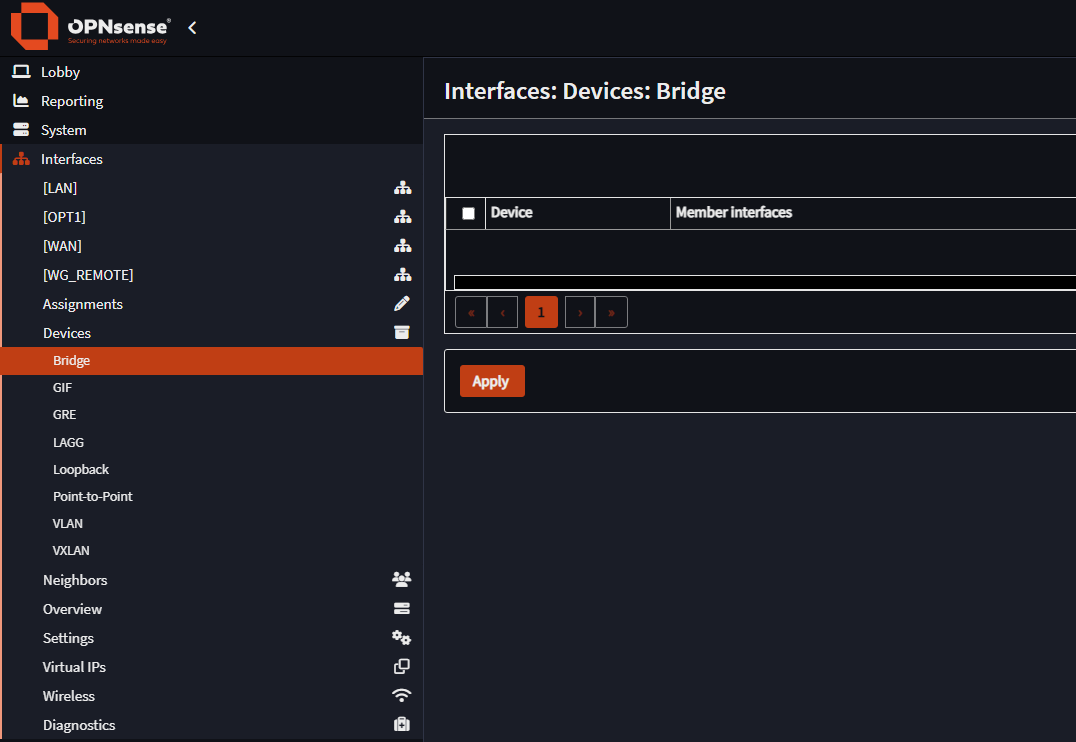 Now on to Interfaces -> Devices -> Bridge. We’re going to add a device here.
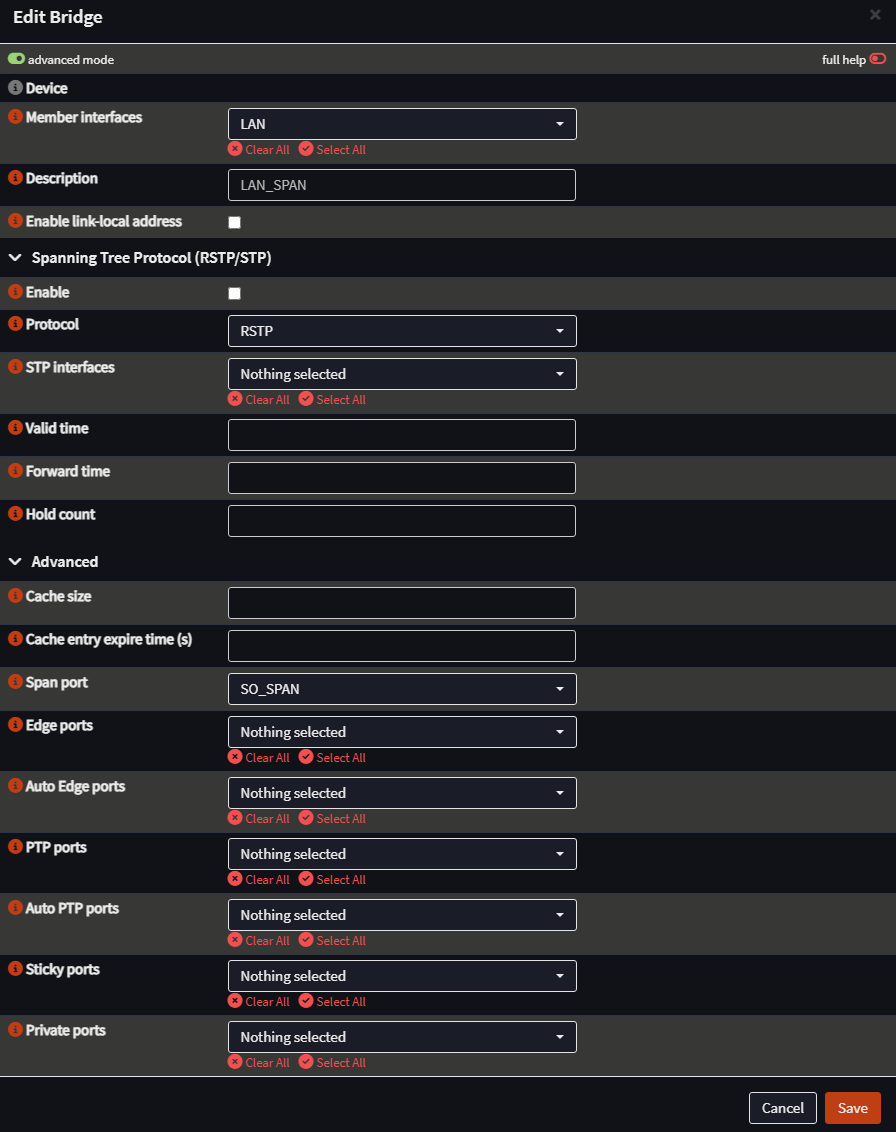 You’ll need to enable advanced mode, then we’ll add out LAN interface under Member Interface, give it a description and then set
 Span port to our configured interface (SO_SPAN). Make sure to save and apply changes. Okay, back over to Proxmox and we’ll see if there’s traffic coming in on that interface now.
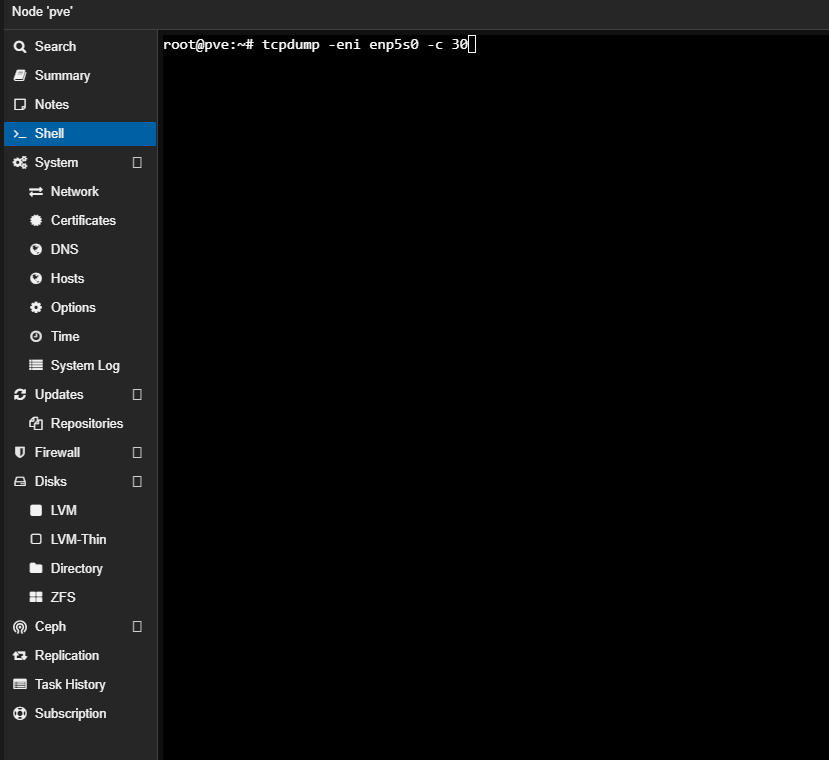 Alright, let’s see.
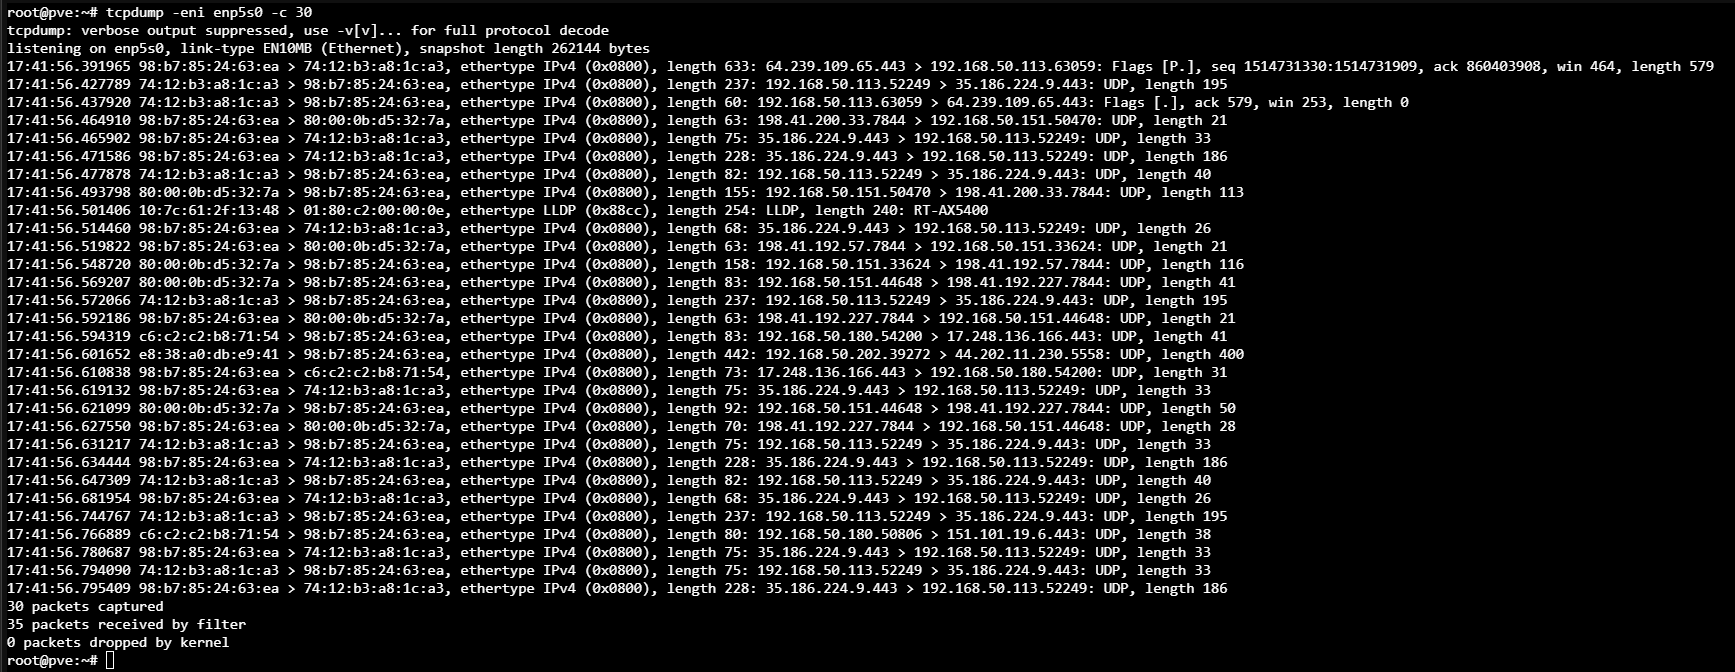 Absolutely amazing, you can see traffic from multiple different hosts on my network here. Okay, couple more things to do.
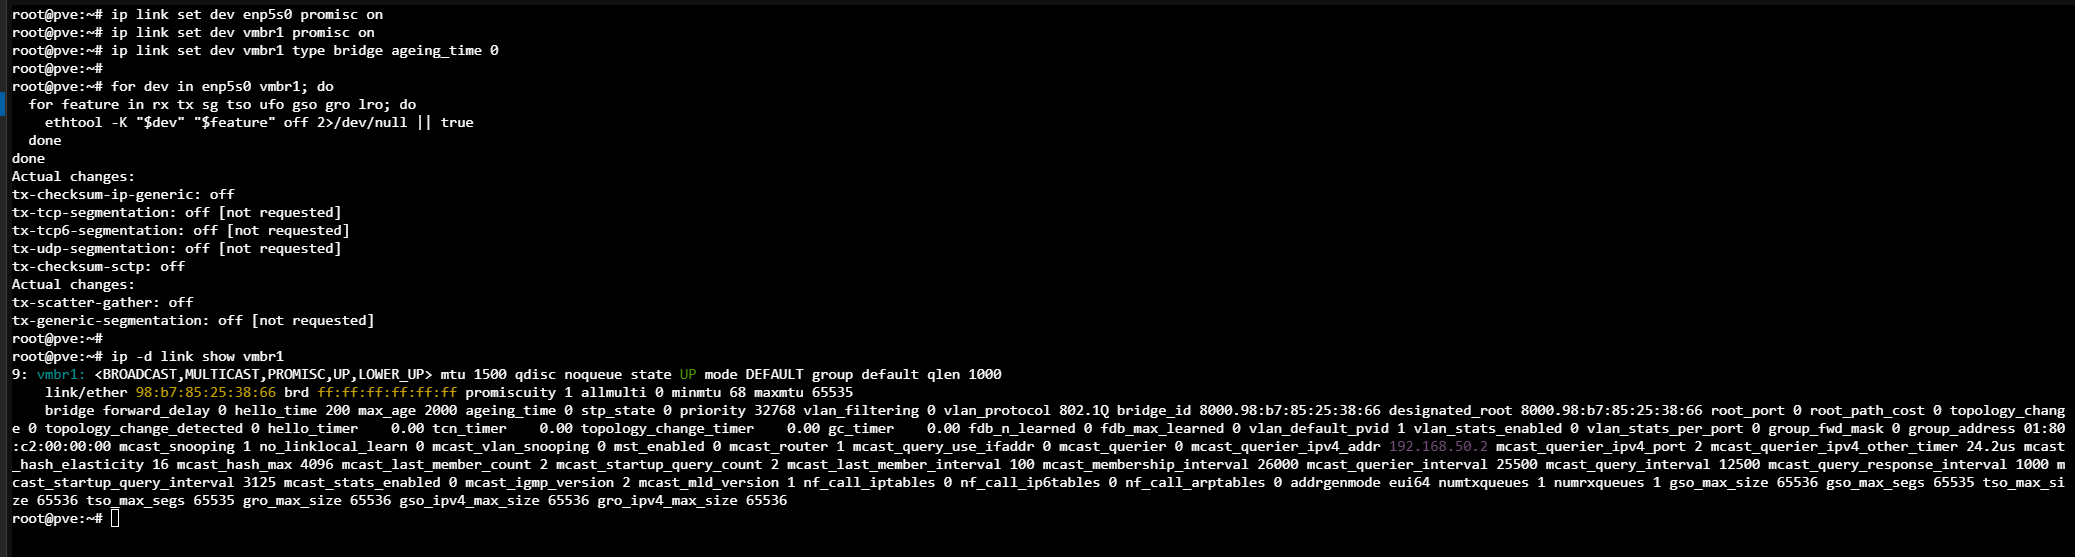
ip link set dev enp5s0 promisc on
ip link set dev vmbr1 promisc on
ip link set dev vmbr1 type bridge ageing_time 0

for dev in enp5s0 vmbr1; do
  for feature in rx tx sg tso ufo gso gro lro; do
    ethtool -K "$dev" "$feature" off 2>/dev/null || true
  done
done

ip -d link show vmbr1
So we enable Promiscuous mode which allows the interface to accept all frames delivered to it. We then set bridge ageing to zero to prevent the bridge from retaining learned forwarding entries that may interfere with mirrored traffic. We run that little for loop there to disable rx, tx, sg, tso, ufo, gso, gro, and lro. Which prevents offloading/aggregation from changing the packet view before Zeek and Suricata inspect it. Finally ip -d link show vmbr1 verifies the resulting bridge state. From that command we see promiscuous mode is up and running. Okay cool, now we can go ahead and continue the Security Onion install.
Security Onion Install Continued…
 Back to our Security Onion VM, let’s click Start Now and then log back in.
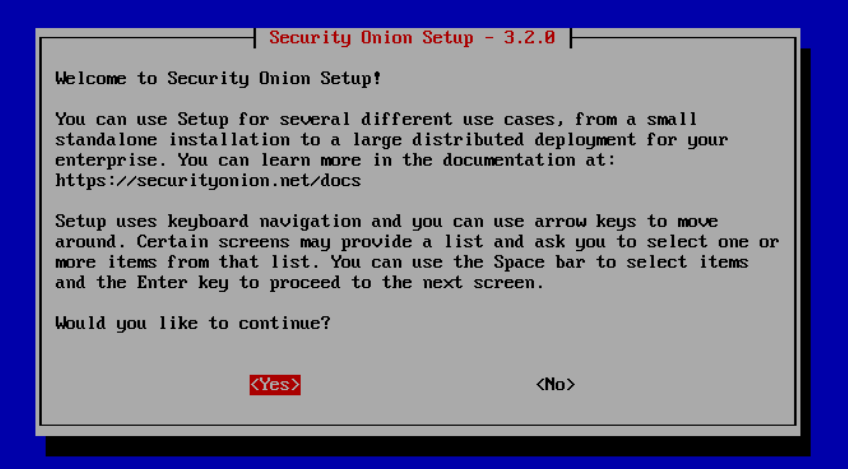 Awesome, okay, let’s get rolling. Yes.
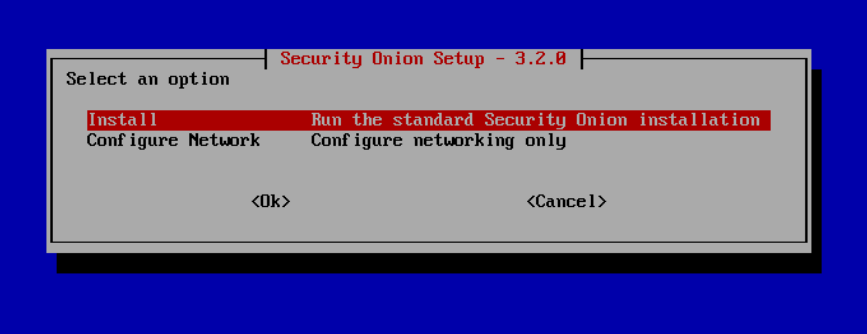 Let’s do the standard installation. Enter.
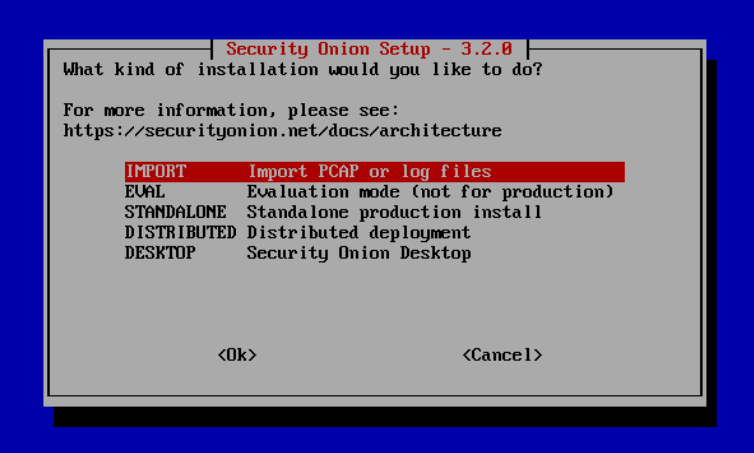 I am going to do a STANDALONE installation. Again, not recommended as my memory is a little lacking, but we’re gonna see how it goes. Enter on STANDALONE or whatever option you want to do.
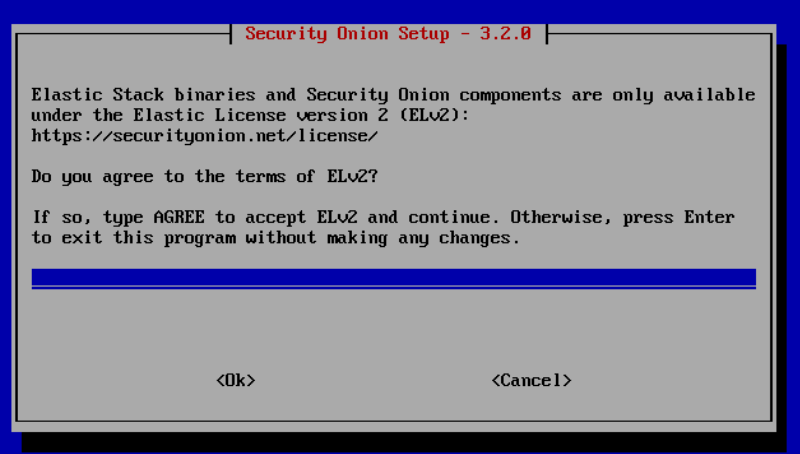 Type AGREE and then enter on OK.
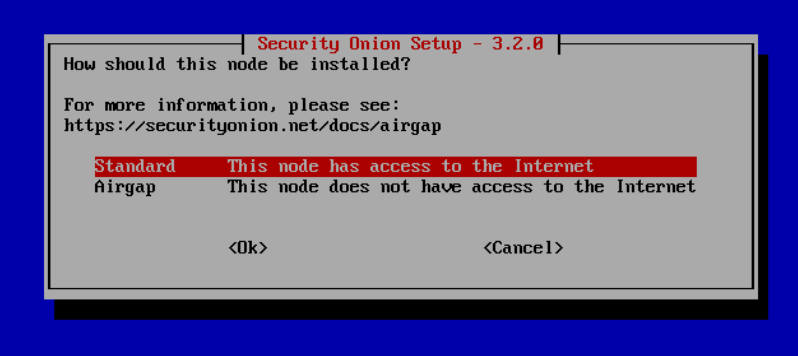 Standard as we have internet access.
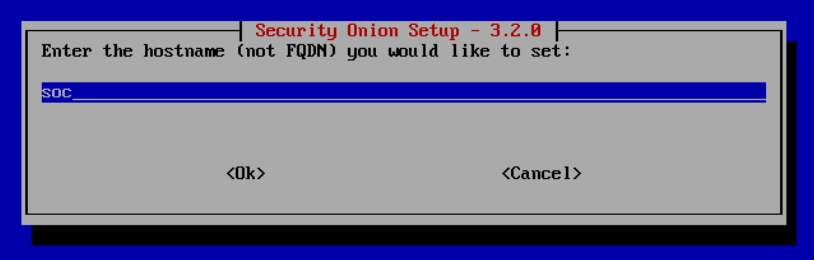 My hostname is going to just be
 soc.
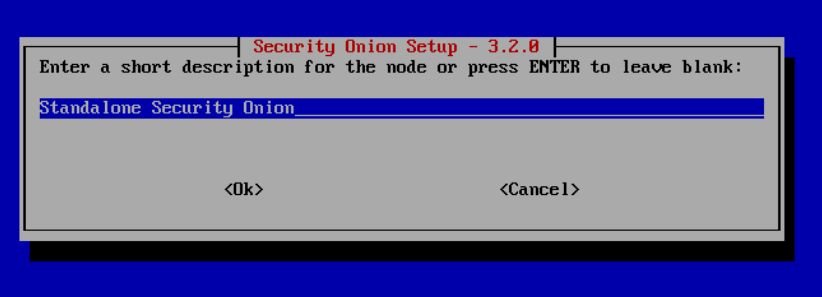 Leave a little description.
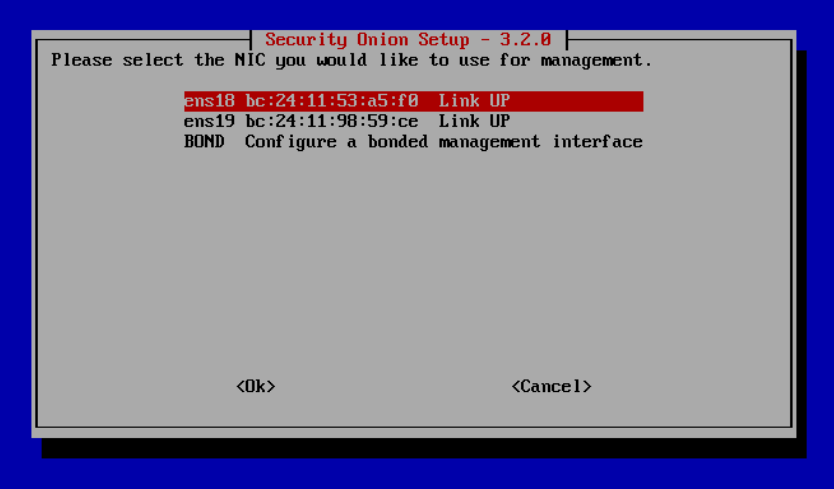 Okay so here we need to select our management interface, not the SPAN port. In this case for me my management interface is going to be
 ens18.
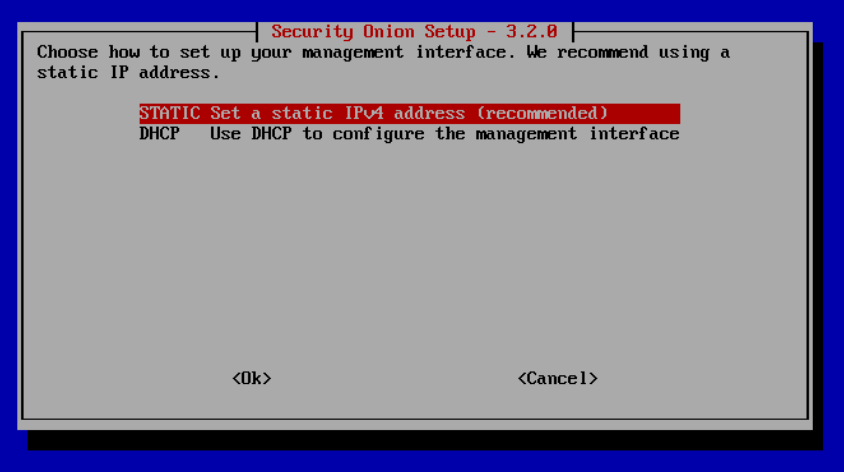 Definitely static, we don’t want DHCP potentially changing our IP later.
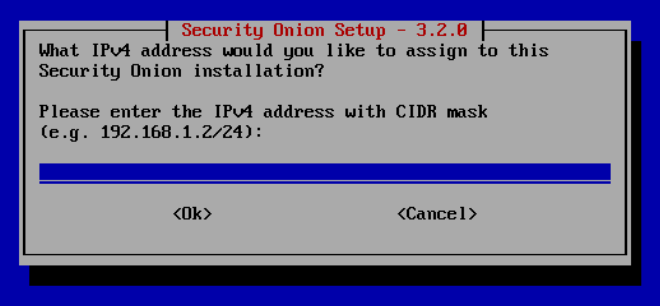 Enter the IP address and subnet mask you want your Security Onion host to have.
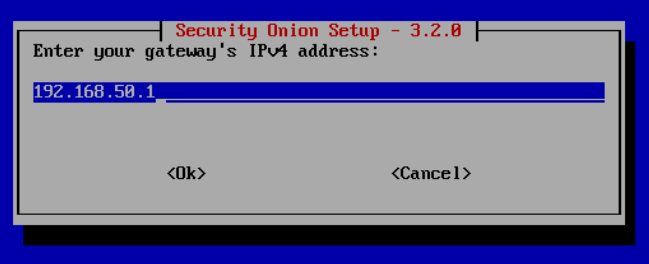 Enter your default gateway.
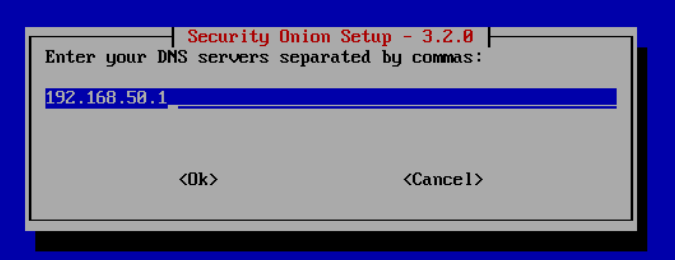 And your DNS servers (which is probably the same, or 8.8.8.8 or something).
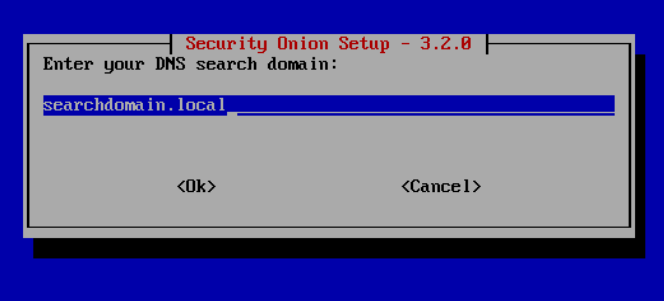 Change this to whatever your internal domain name is.
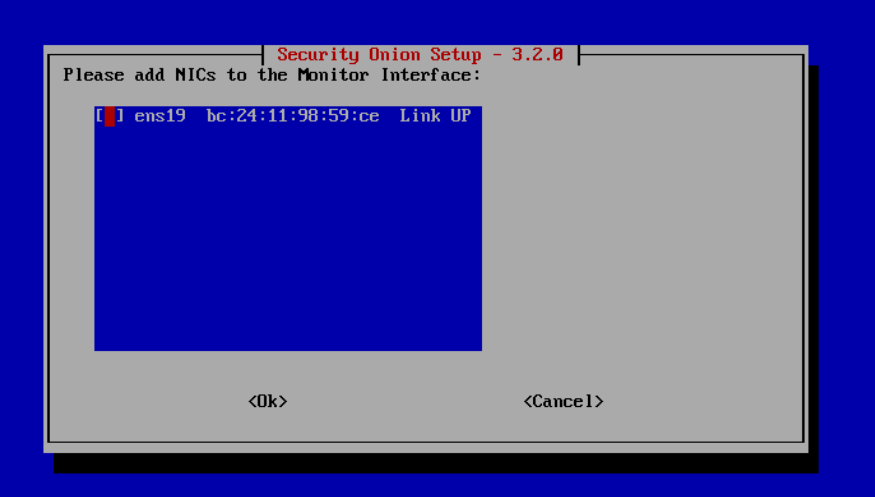 Okay, now we’re going to select our monitoring interface, which is what we configured earlier. Click space on the interface you want and then OK.
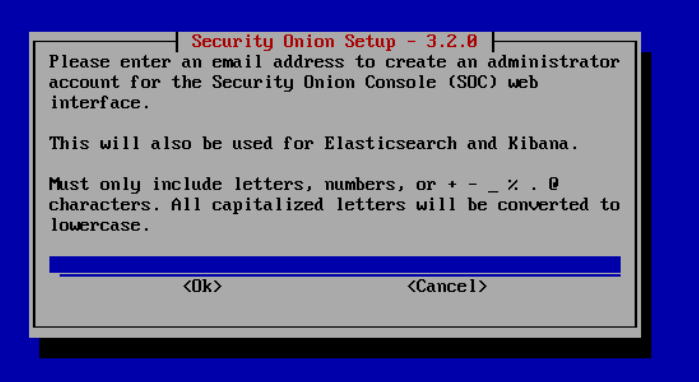 Enter the email you want to log into Security Onion with. It will also prompt you for a password, fill all that out.
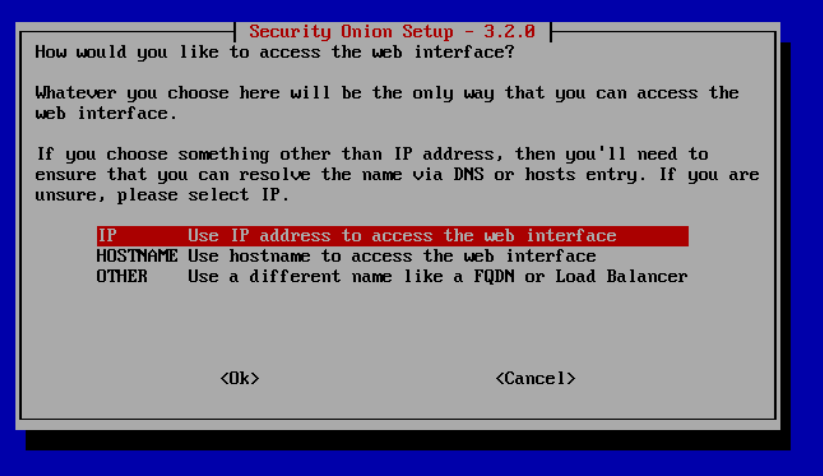 After that you’ll be prompted how we want to access the web console. We’ll do IP for now.
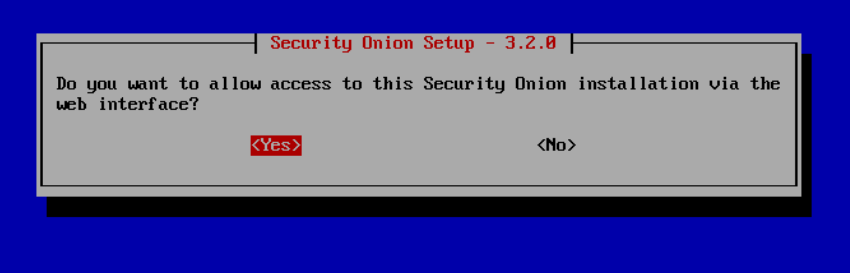 Uh yeah, we’d like to be able to access the web console.
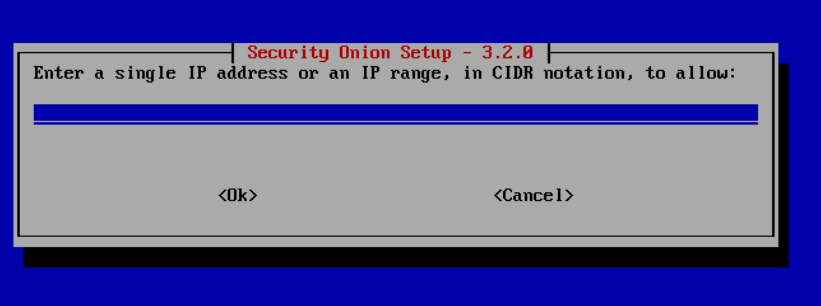 Enter you’re local network CIDR (192.168.1.0/24).
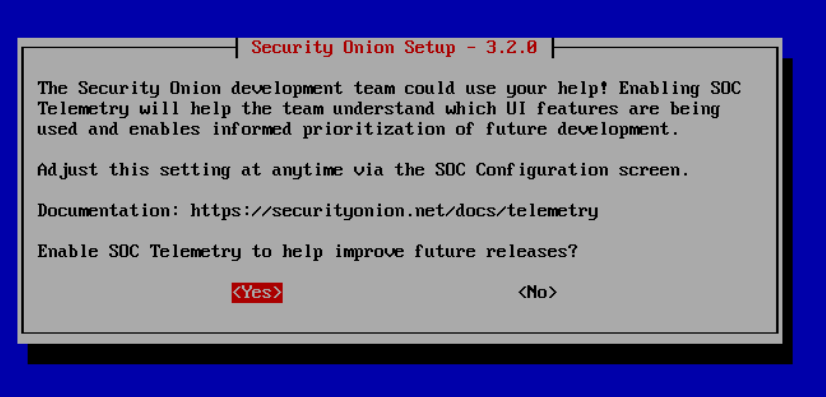 Normally I’d say no, but I know a lot of people on the team, so I’m actually gonna allow it. After this message it will display everything you’ve configured thus far. Review it and if it’s good select Yes. The installation will now begin. It may take a while so feel free to do something else for a minute and then come back.
After it’s done if we open a browser and go to the IP of our Security Onion VM…
Normally I’d say no, but I know a lot of people on the team, so I’m actually gonna allow it. After this message it will display everything you’ve configured thus far. Review it and if it’s good select Yes. The installation will now begin. It may take a while so feel free to do something else for a minute and then come back.
After it’s done if we open a browser and go to the IP of our Security Onion VM…
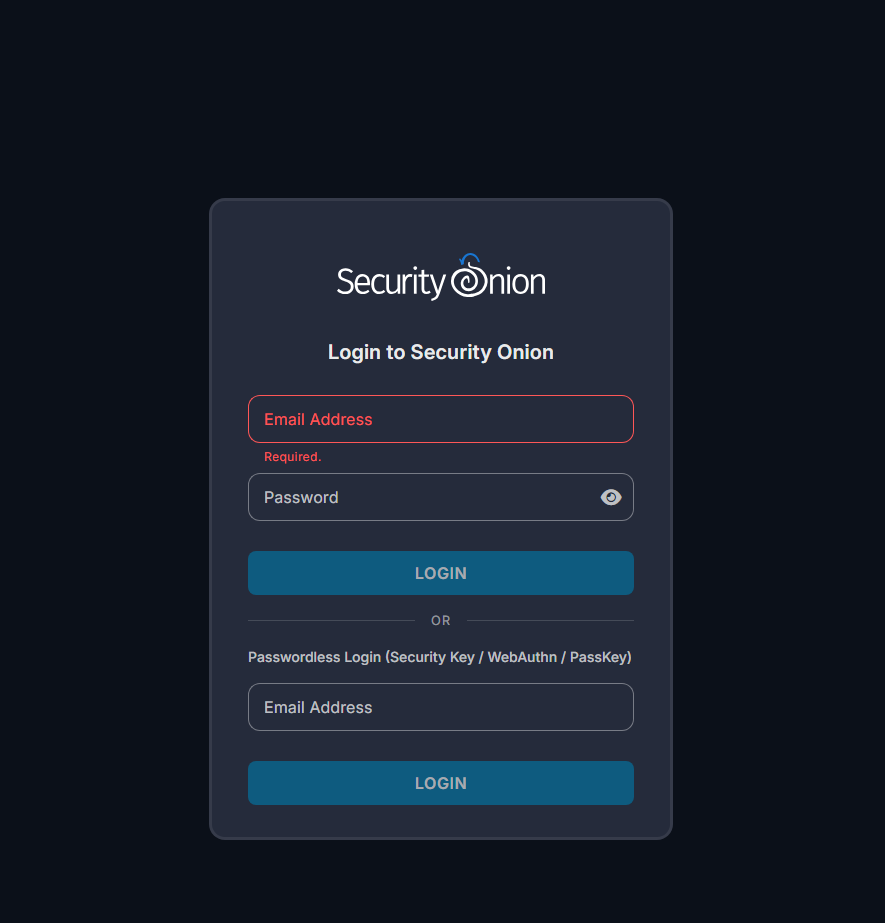 Looking good, sign in with your email and password you set up during the install.
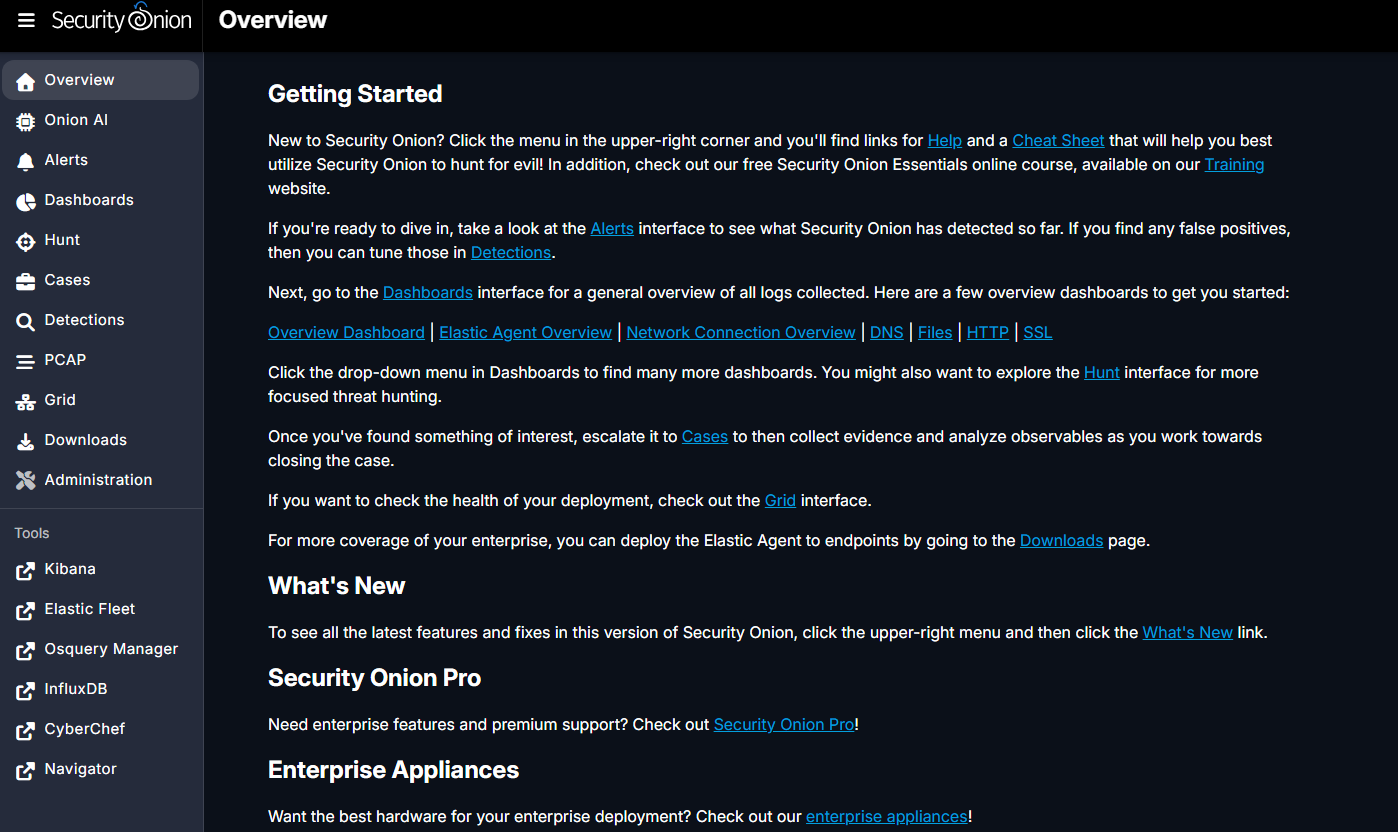 And look at that. Our Security Onion install appears to have gone pretty well. Now, Security Onion has a ton of features and I will not be covering really any of them in all honesty. Today we are mainly worried about getting it running and making sure we’re getting telemetry. The Security Onion YouTube channel has some great free training if you want to learn a little more about all the cool stuff you can do.
Troubleshooting SPAN
Now while this is great and all, if we go to Dashboards we will notice a problem.
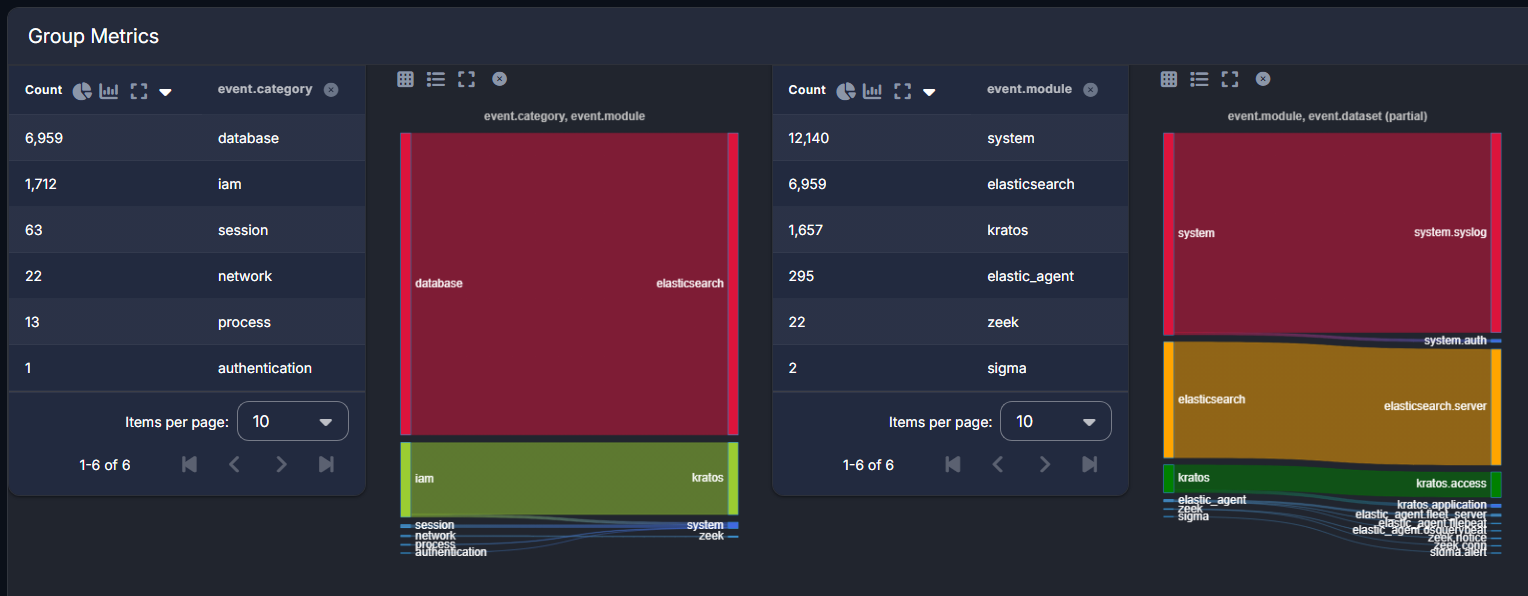 I’m not getting really any information from Zeek at all, which indicates to me our monitoring interface is not working as intended. Now after a little bit of troubleshooting, I found out the issue and it’s actually listed in the documentation so shame on me.
 I am running Proxmox 9 or higher, so let’s go into Proxmox and change the MTU on our sniffing interface.
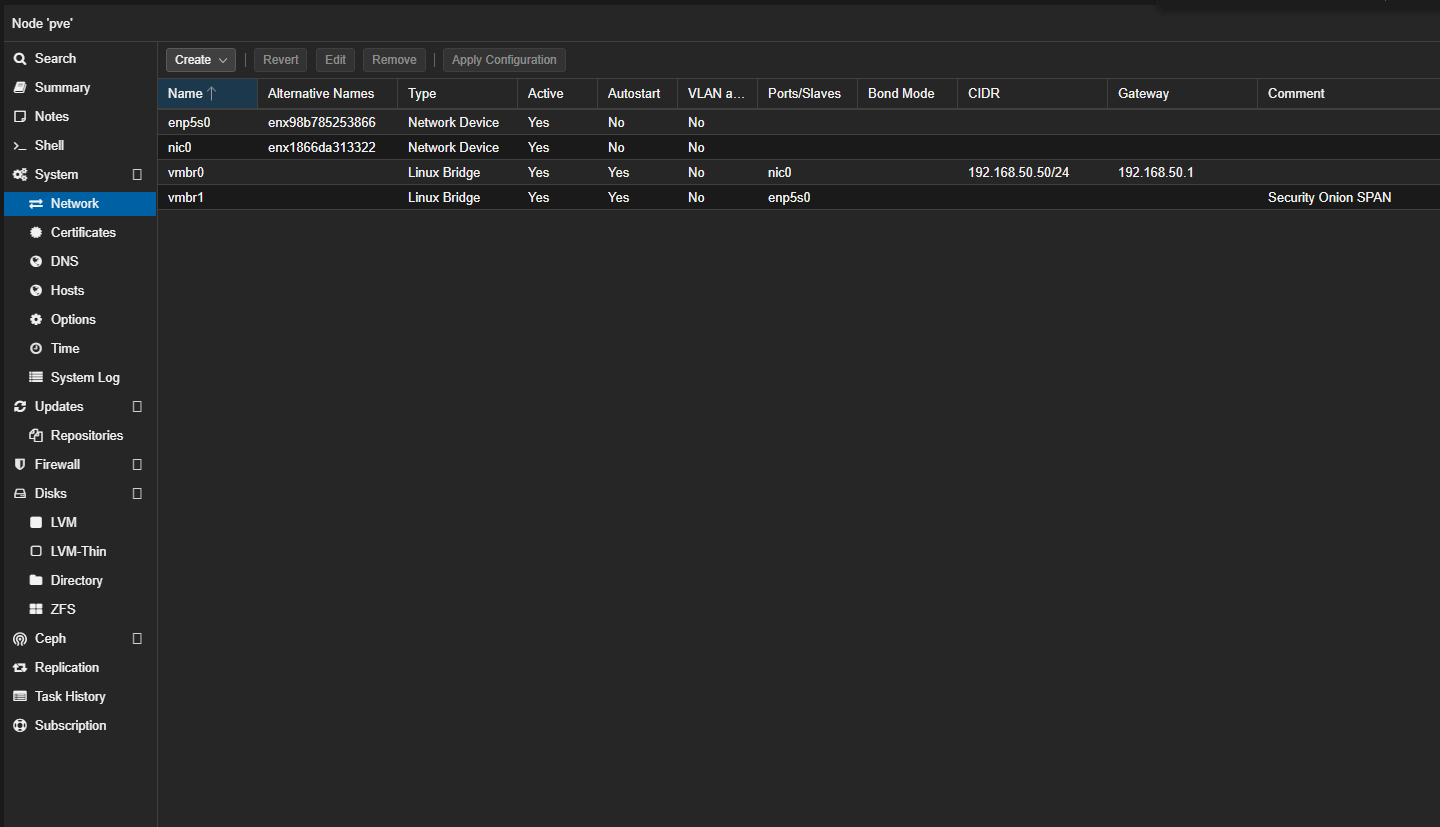 Back to our pve node, under Network. Let’s edit the physical interface and the virtual interface.
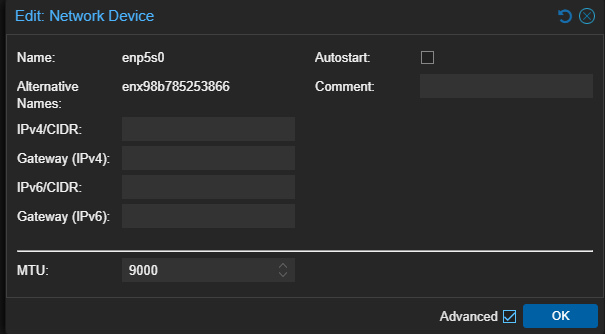 First let’s change the MTU to 9000 on the physical interface. OK.
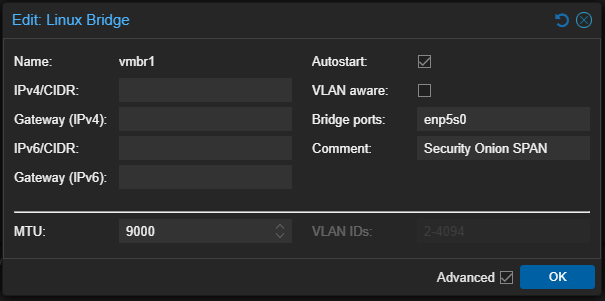 Now on the virtual interface. After those changes, make sure to hit the Apply Configuration button at the top. Okay, back to our Security Onion VM.
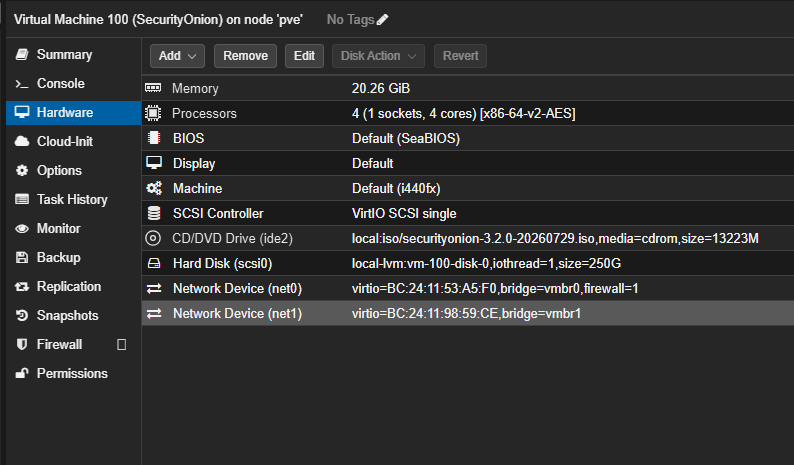 Under Hardware, we’re going to edit the net1 network device.
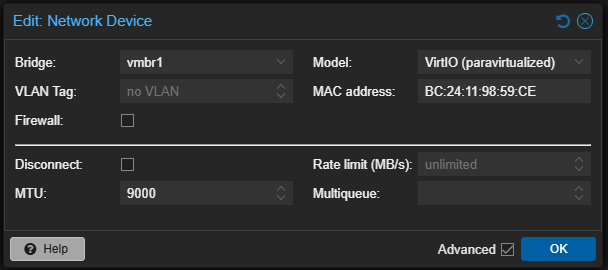 And set this last one’s MTU to 9000 as well. Now we are going to restart the VM. After it comes back up, let’s verify that it works.
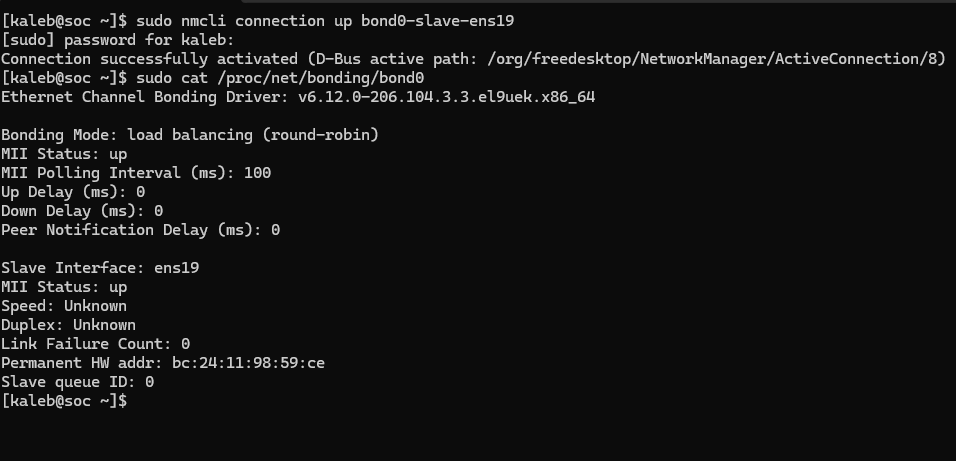 Very good, we see ens19 listed as a slave interface, which we weren’t seeing before. If that interface doesn’t exist for you, you may need to run
 sudo so-monitor-add <interface> to add your physical interface as a monitoring interface. As an additional verification:
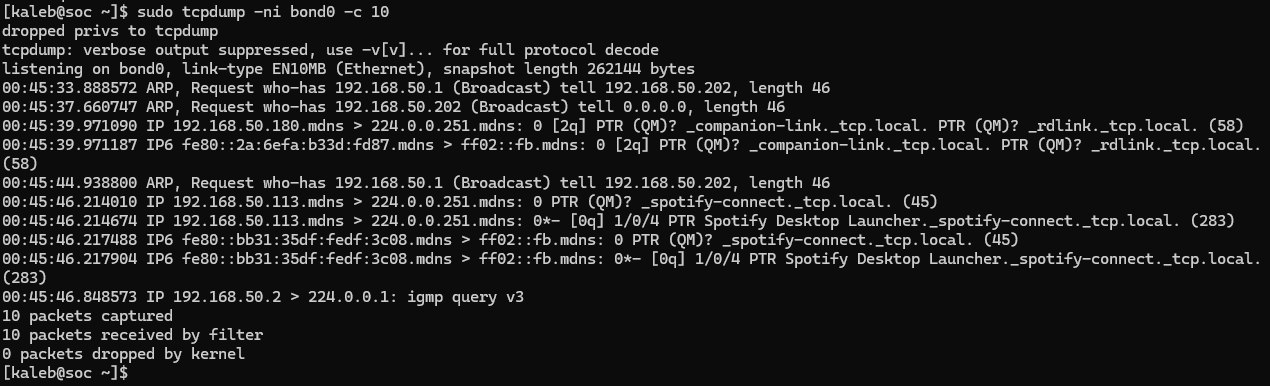 When we listen on
 bond0 we appear to be able to see LAN traffic to and from other hosts. Okay cool. Now if we go to Hunt in Security Onion.
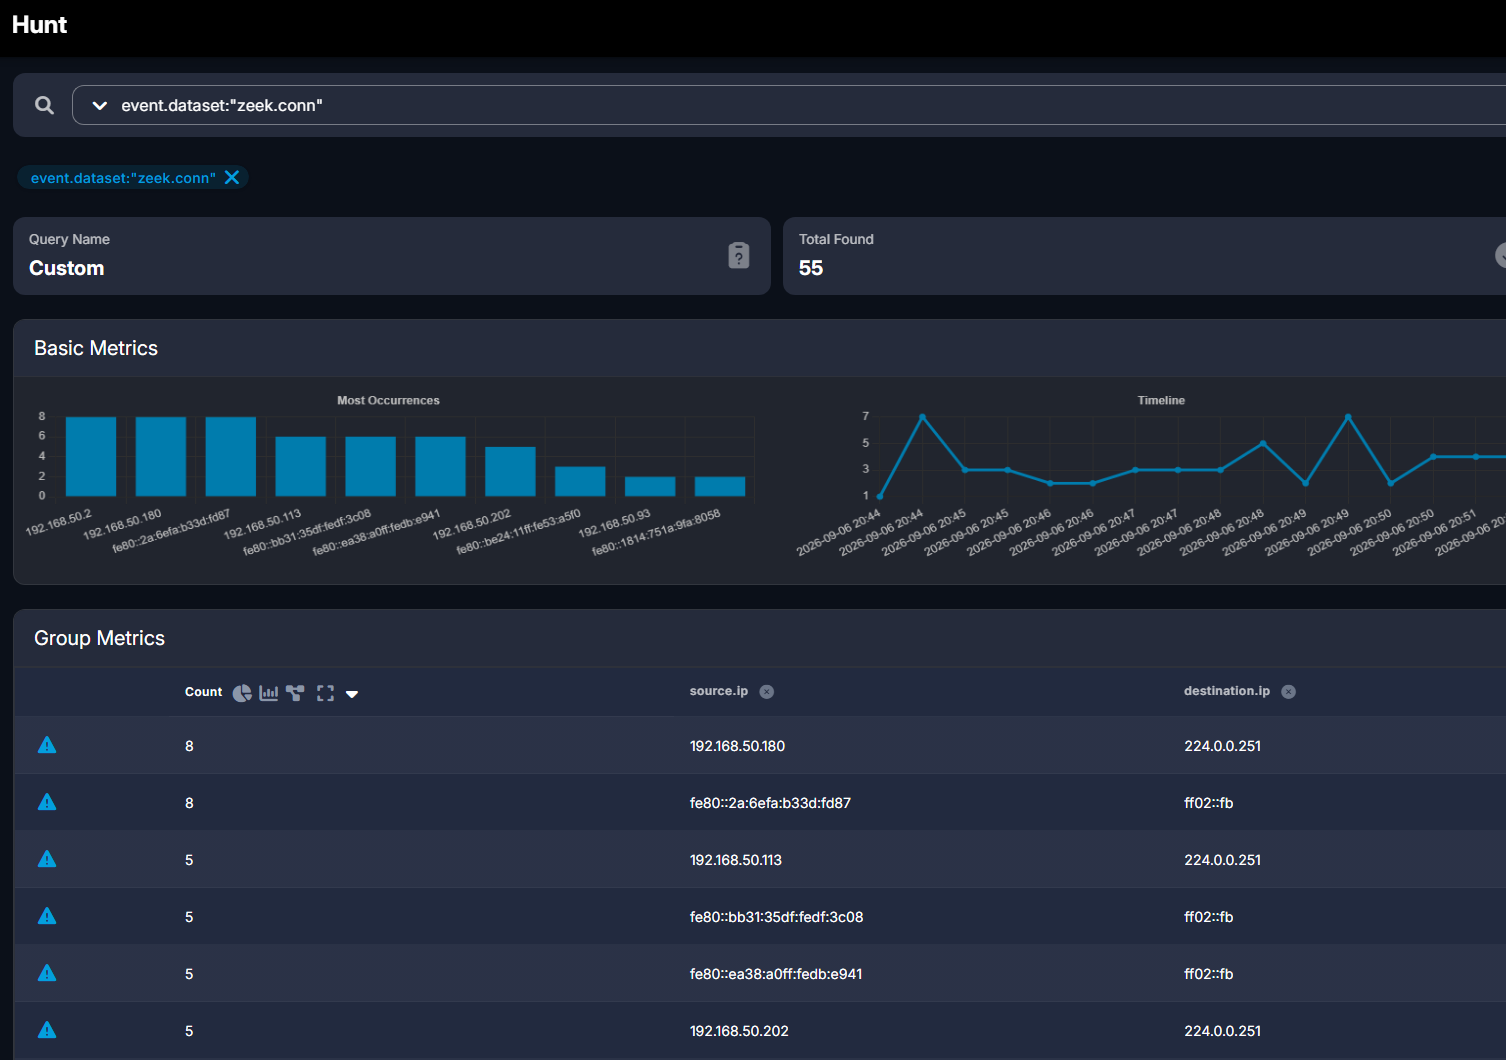 And query
 event.dataset:"zeek.conn" we finally start to see our network data. Awesome, let’s go.
Installing Elastic Agent
Okay cool, we have network visibility, now it’s time to get host visibility. We are actually going to go through installing Elastic Agent on a Windows host and a Linux host, one of each.
Before we go downloading anything to anywhere though, we need to make a quick change to some configuration settings in Security Onion.
If we go Administration -> Configuration -> firewall -> hostgroups -> elastic_agent_endpoint:
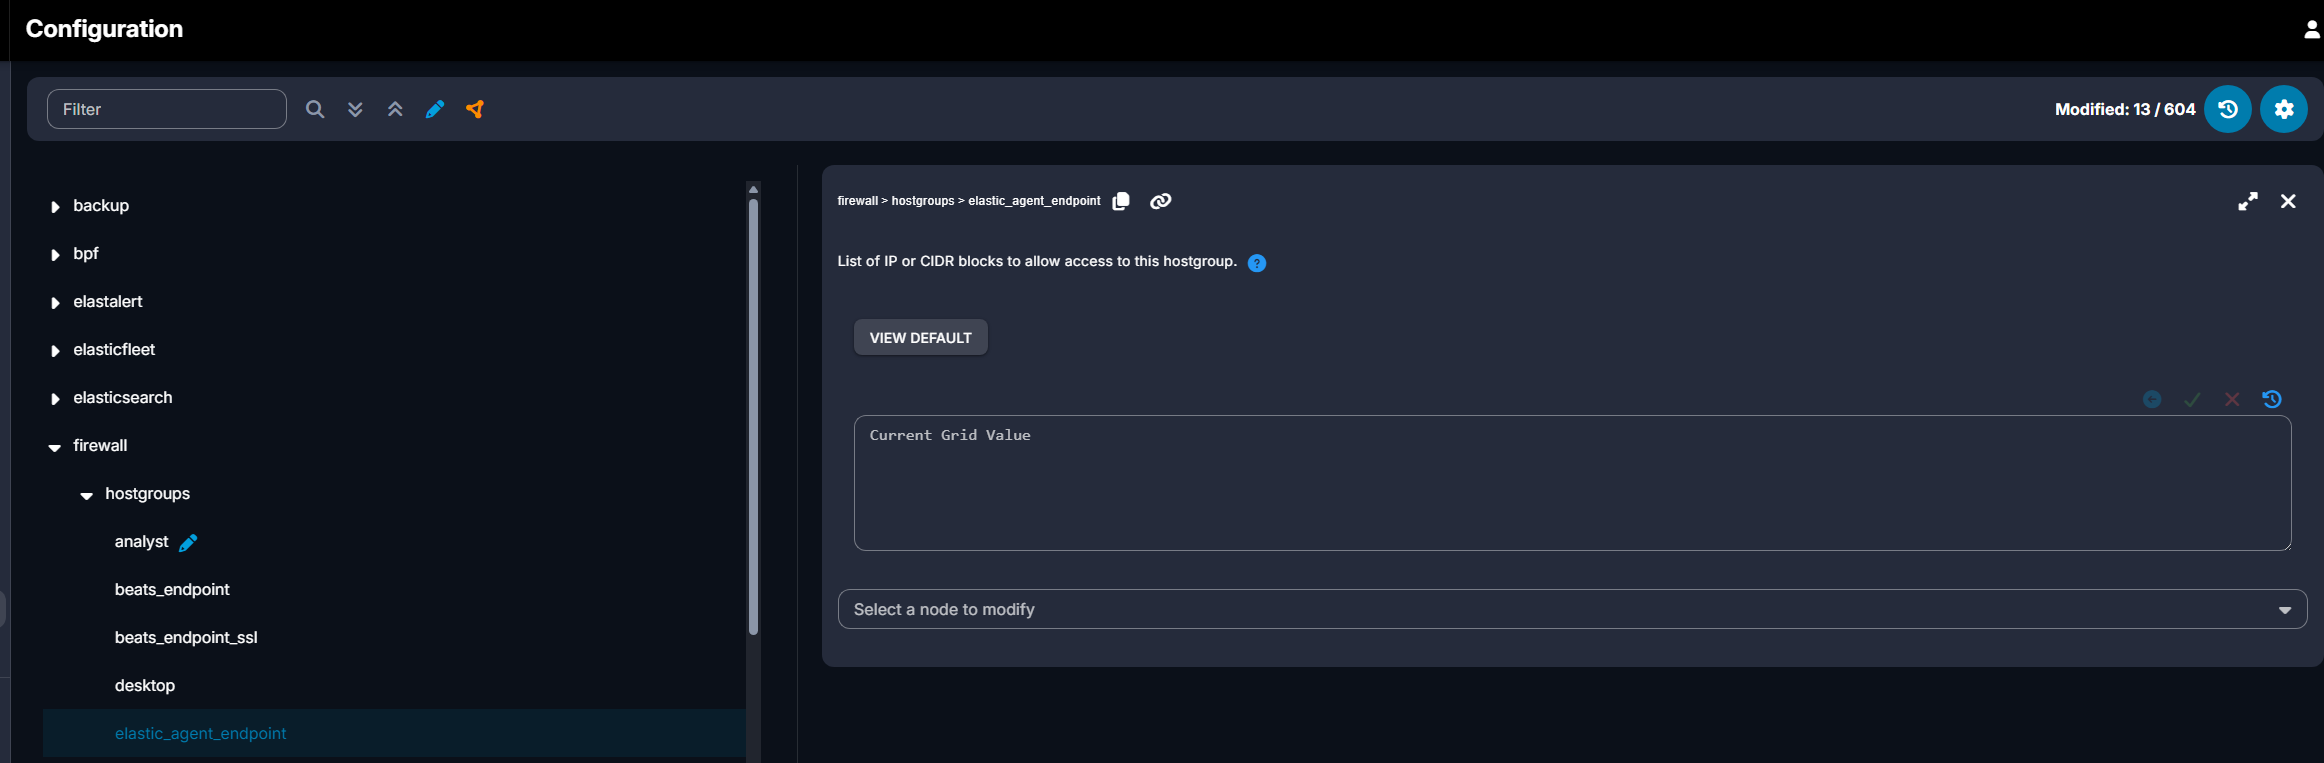 Here we need to add an entry to allow agents from our LAN to communicate with Security Onion. Now typically it’s best practice to configure an entry for each host you want to monitor, but I’m just going to add an entry for my whole LAN.
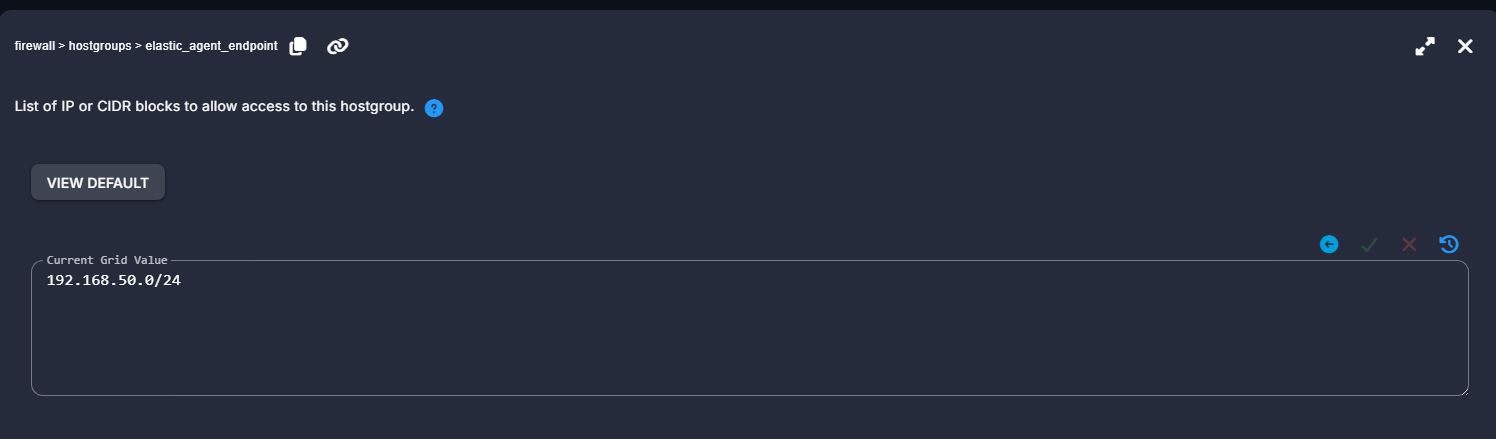 Like so. After you make your changes, hit the green checkmark to save. Alright, now let’s test reachability from a remote host.
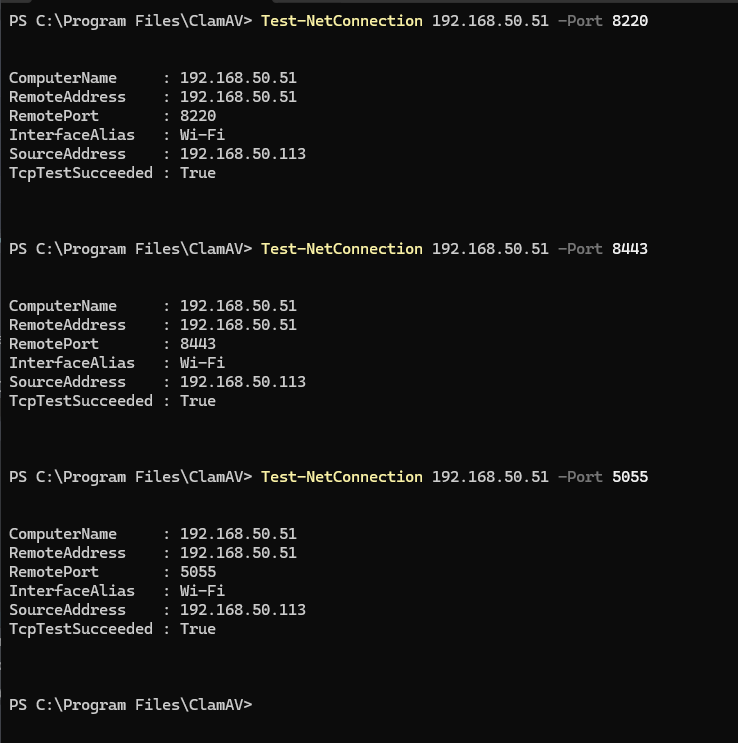 Awesome, all three connection tests returned True so our Elastic Agent should be able to communicate once installed. With that out of the way, let’s go ahead and install Elastic Agent to our Windows host.
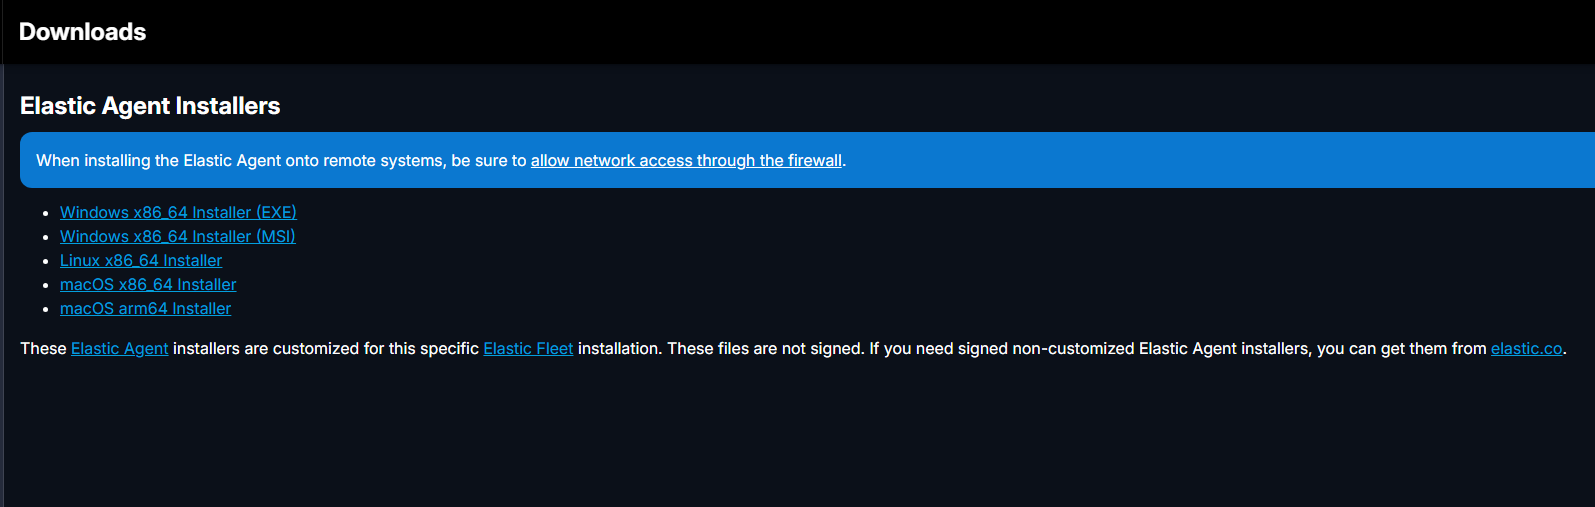 In Security Onion under Downloads, we’re going to download the MSI installer for x64 Windows and then run the file. Now I would have a screenshot of that, but there’s no interaction needed on our end, it’ll just run. After it finishes if we go to Elastic Fleet in Security Onion, which is on the left hand side menu.
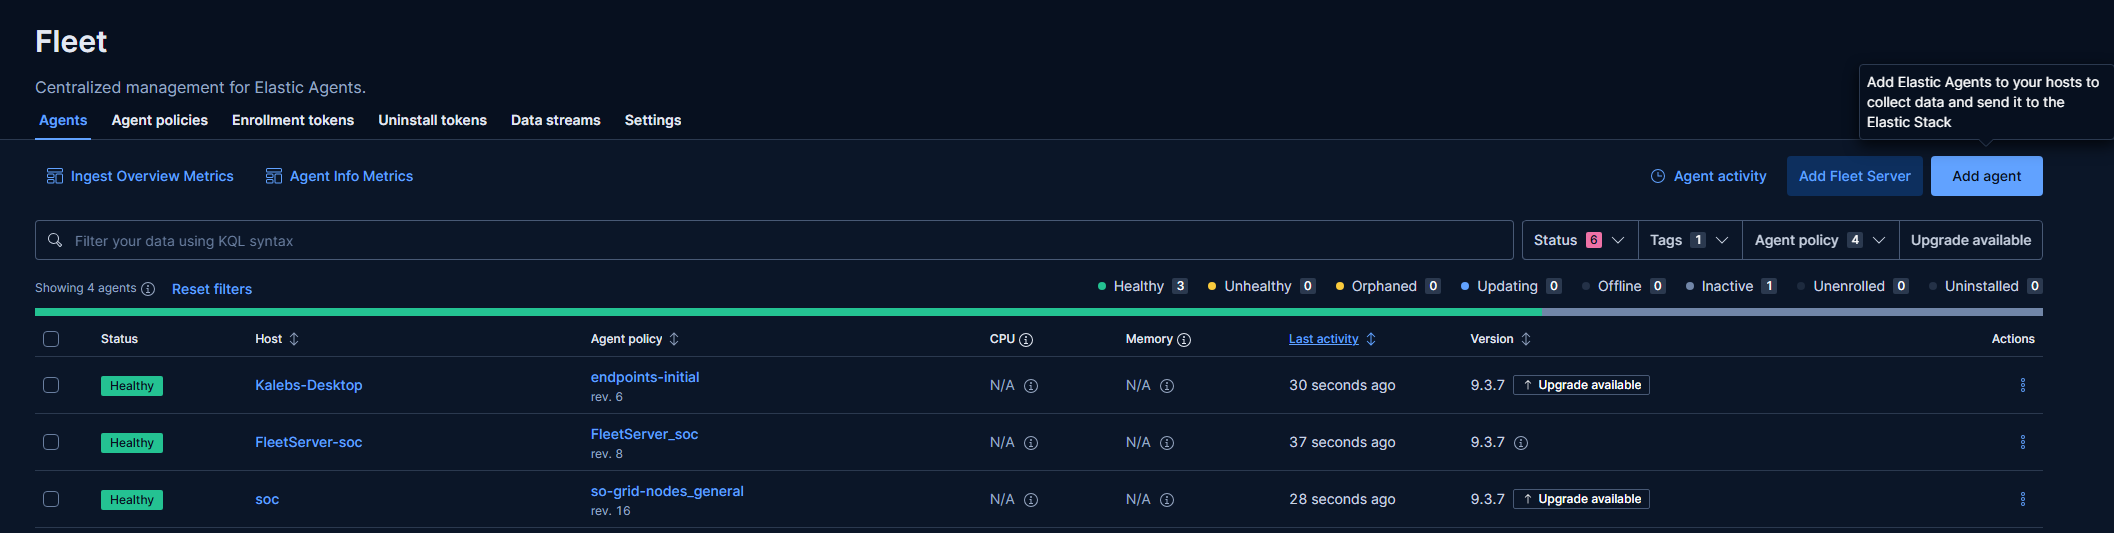 And we can see my Desktop is enrolled with Elastic Fleet. Okay, too easy! Time to get a Linux host in here. We’ll download the installer from my Windows host and then
 scp it over to my laptop server.
 Awesome, looks like the transfer went off without a hitch.
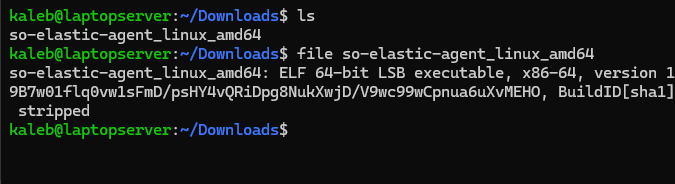 Alright cool, it is an ELF file. I was trying to download with curl earlier and realized I needed to bypass the certificate error and provide my credentials so I just decided to do the
 scp method instead. Okay let’s change the permissions and then run the installer.
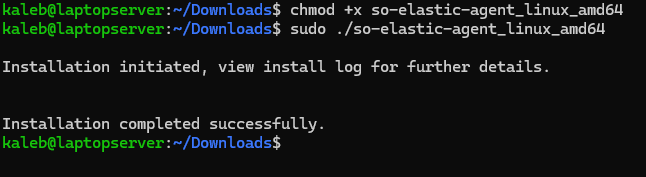 Okay, too easy. Let’s quickly verify it.
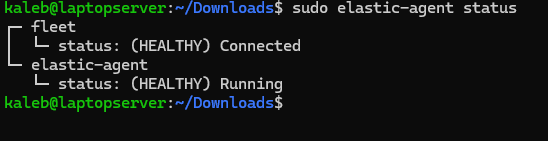 Awesome, let’s check in Fleet.
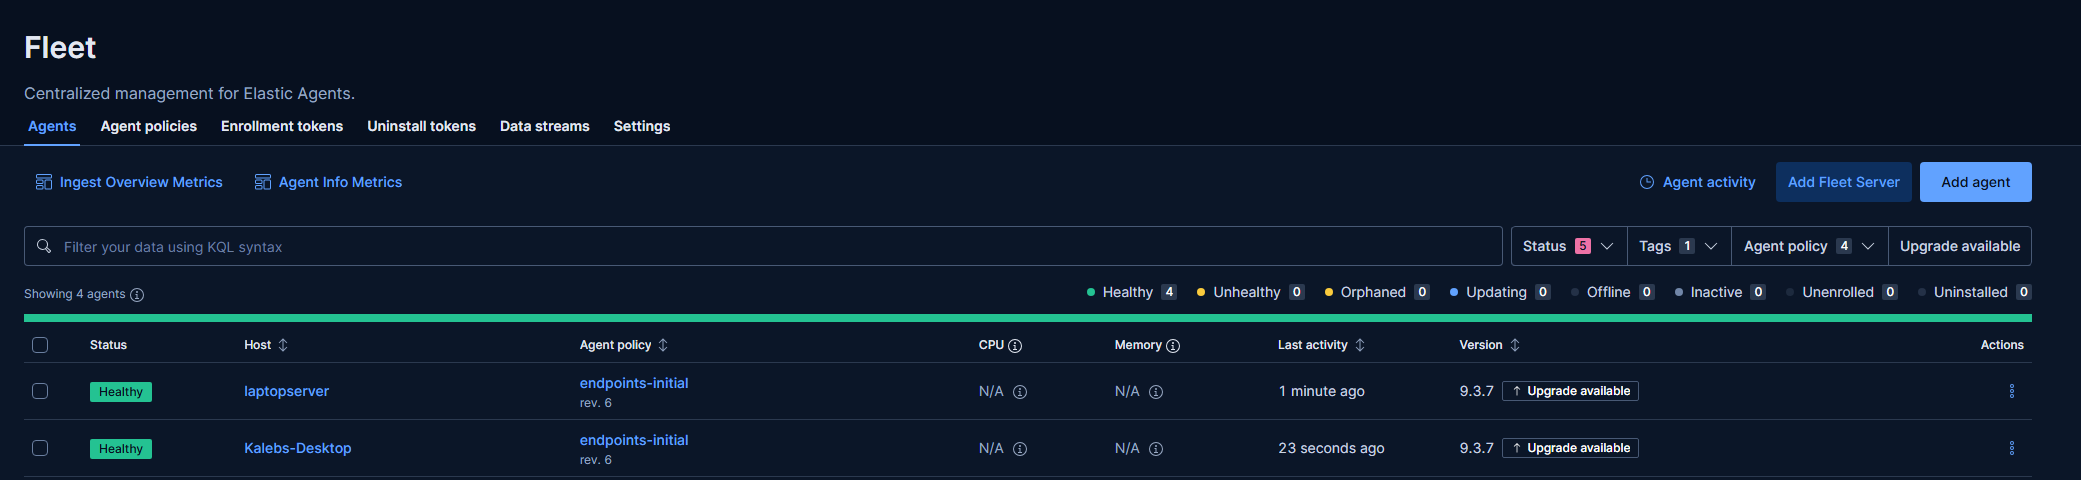 Amazing, both agents are healthy and good to go. Now that we have network and some host visibility, let’s go to Alerts in Security Onion and see if my network has any crazy alerts that have already gotten detected.
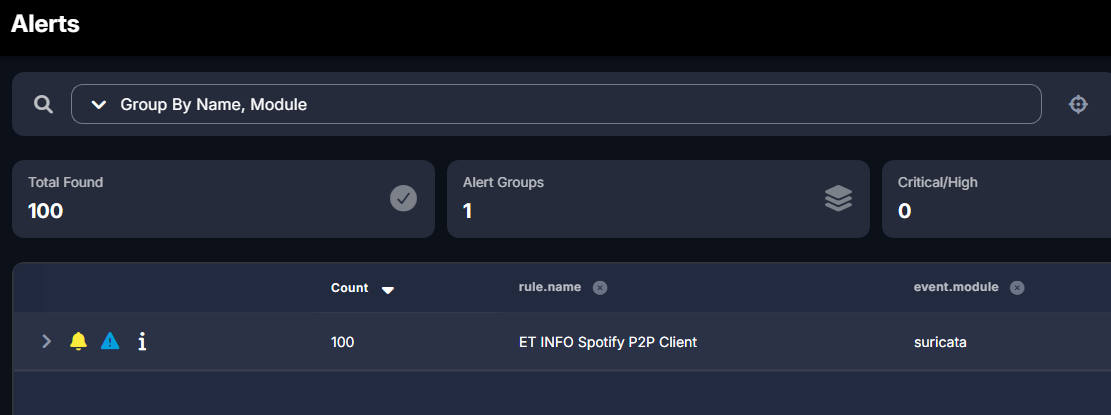 And it looks like I have 100 hits of the low severity Spotify alert? If we want more info on an alert we can click on that lowercase “i” information icon on the row of the alert.
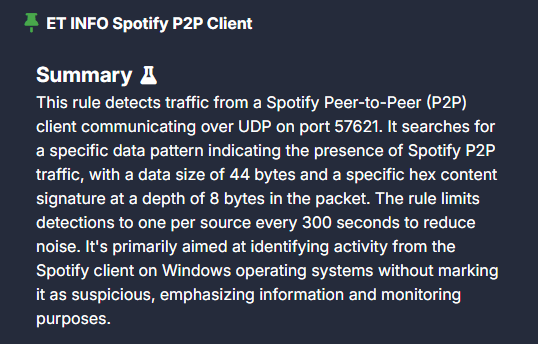 So it turns out my Spotify app on my desktop is sending out discovery messages out to a multicast address on my local network to see if anyone wants to listen to some sick beats with me. This definitely is benign behavior for my network. If we saw this alert on our corporate network, where Spotify is not installed on our hosts, we may want to look into this more.