Deploying Grafana, Prometheus and Uptime Kuma
Introduction
So this entries going to be a bit of a doozy everyone. We’re going to be deploying all of our non-security monitoring tools. By that I mean tools that monitor uptime and system resource usage, good old’ fashioned sys admin things. To do this we will be deploying three different services. First off Grafana, a very popular data visualization tool which I cannot express just how much you can do with it. Second, Prometheus, which will be used to scrape the data from our endpoints and will get ingested by Grafana. Finally, Uptime Kuma so that we can monitor the uptime of our services and receive alerts if any of our services go down. So if that sounds fun then stayed tuned for this thrilling addition of homelabs with Karmic!
Deploying our Containers
Alright, as always, let’s make some directories for our config files to live.
 And now we’re going to make our Docker Compose file in this
 monitoring directory.

# Once again for your copy and paste needs
services:
  prometheus:
    image: prom/prometheus:latest
    container_name: prometheus
    restart: unless-stopped
    command:
      - --config.file=/etc/prometheus/prometheus.yml
      - --storage.tsdb.path=/prometheus
      - --storage.tsdb.retention.time=15d
      - --storage.tsdb.retention.size=5GB
      - --web.enable-lifecycle
    ports:
      - "9090:9090"
    volumes:
      - ./prometheus/prometheus.yml:/etc/prometheus/prometheus.yml:ro
      - prometheus_data:/prometheus
    mem_limit: 1g
    networks:
      - monitoring

  node-exporter:
    image: quay.io/prometheus/node-exporter:latest
    container_name: node-exporter
    restart: unless-stopped
    command:
      - --path.rootfs=/host
    network_mode: host
    pid: host
    volumes:
      - /:/host:ro,rslave
    mem_limit: 128m

  grafana:
    image: grafana/grafana:latest
    container_name: grafana
    restart: unless-stopped
    depends_on:
      - prometheus
    ports:
      - "3000:3000"
    environment:
      GF_USERS_ALLOW_SIGN_UP: "false"
    volumes:
      - grafana_data:/var/lib/grafana
      - ./grafana/provisioning:/etc/grafana/provisioning:ro
    mem_limit: 512m
    networks:
      - monitoring

  uptime-kuma:
    image: louislam/uptime-kuma:2
    container_name: uptime-kuma
    restart: unless-stopped
    ports:
      - "3001:3001"
    volumes:
      - uptime_kuma_data:/app/data
    mem_limit: 512m
    networks:
      - monitoring

networks:
  monitoring:
    name: monitoring

volumes:
  prometheus_data:
  grafana_data:
  uptime_kuma_data:
Amazing. Now we’re also going to need to make a YAML file under the Prometheus subdirectory as this will tell our Prometheus container where to scrape data from.

global:
  scrape_interval: 30s
  evaluation_interval: 30s

scrape_configs:
  - job_name: prometheus
    static_configs:
      - targets:
          - prometheus:9090

  - job_name: node
    static_configs:
      - targets:
          - 192.168.50.151:9100
        labels:
          instance: UbuntuDesktop
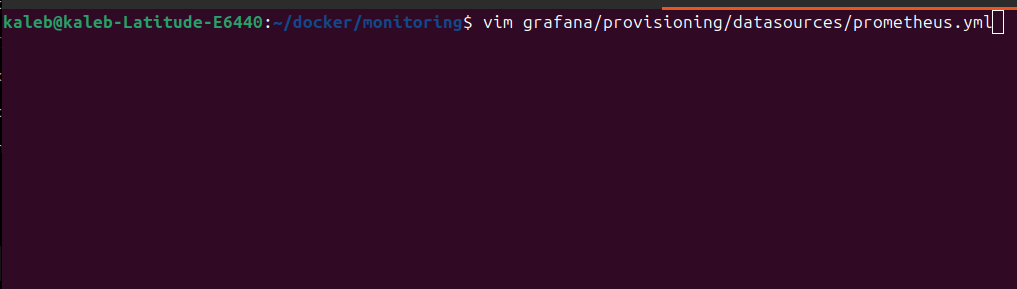
We also need to provision Grafana and Prometheus’s connection with yet another YAML file here.
# Once again, here you are
apiVersion: 1

datasources:
  - name: Prometheus
    uid: prometheus
    type: prometheus
    access: proxy
    url: http://prometheus:9090
    isDefault: true
    editable: true
Alright, the core of these containers should be good to go, so let’s try spinning them up.
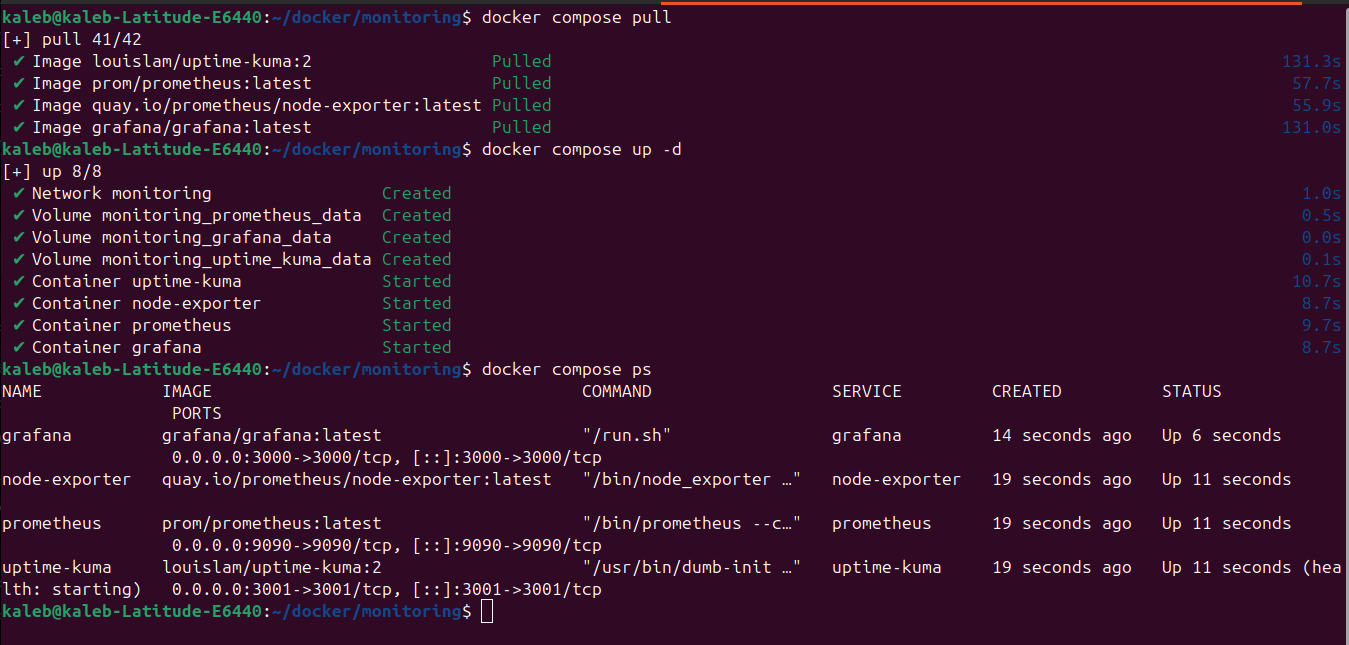 Okay, so far so good, the container images got pulled down and started and they seem to be all up.
Let’s run some tests by curling a few different endpoints.
Okay, so far so good, the container images got pulled down and started and they seem to be all up.
Let’s run some tests by curling a few different endpoints.
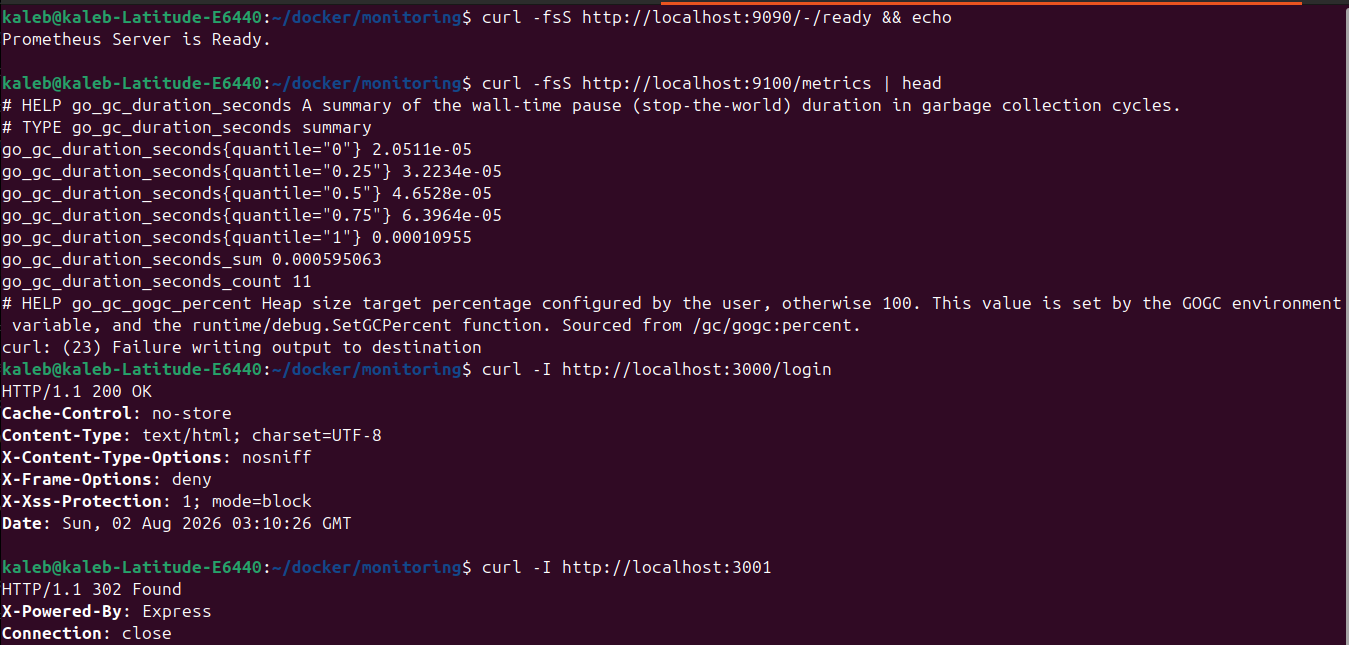 Awesome, everything is returning 200’s and relevant information so we’re looking good. Let’s now navigate to the /targets endpoint appended to the socket that’s hosting Prometheus. In this case it’s http://192.168.50.151:9090/targets for me.
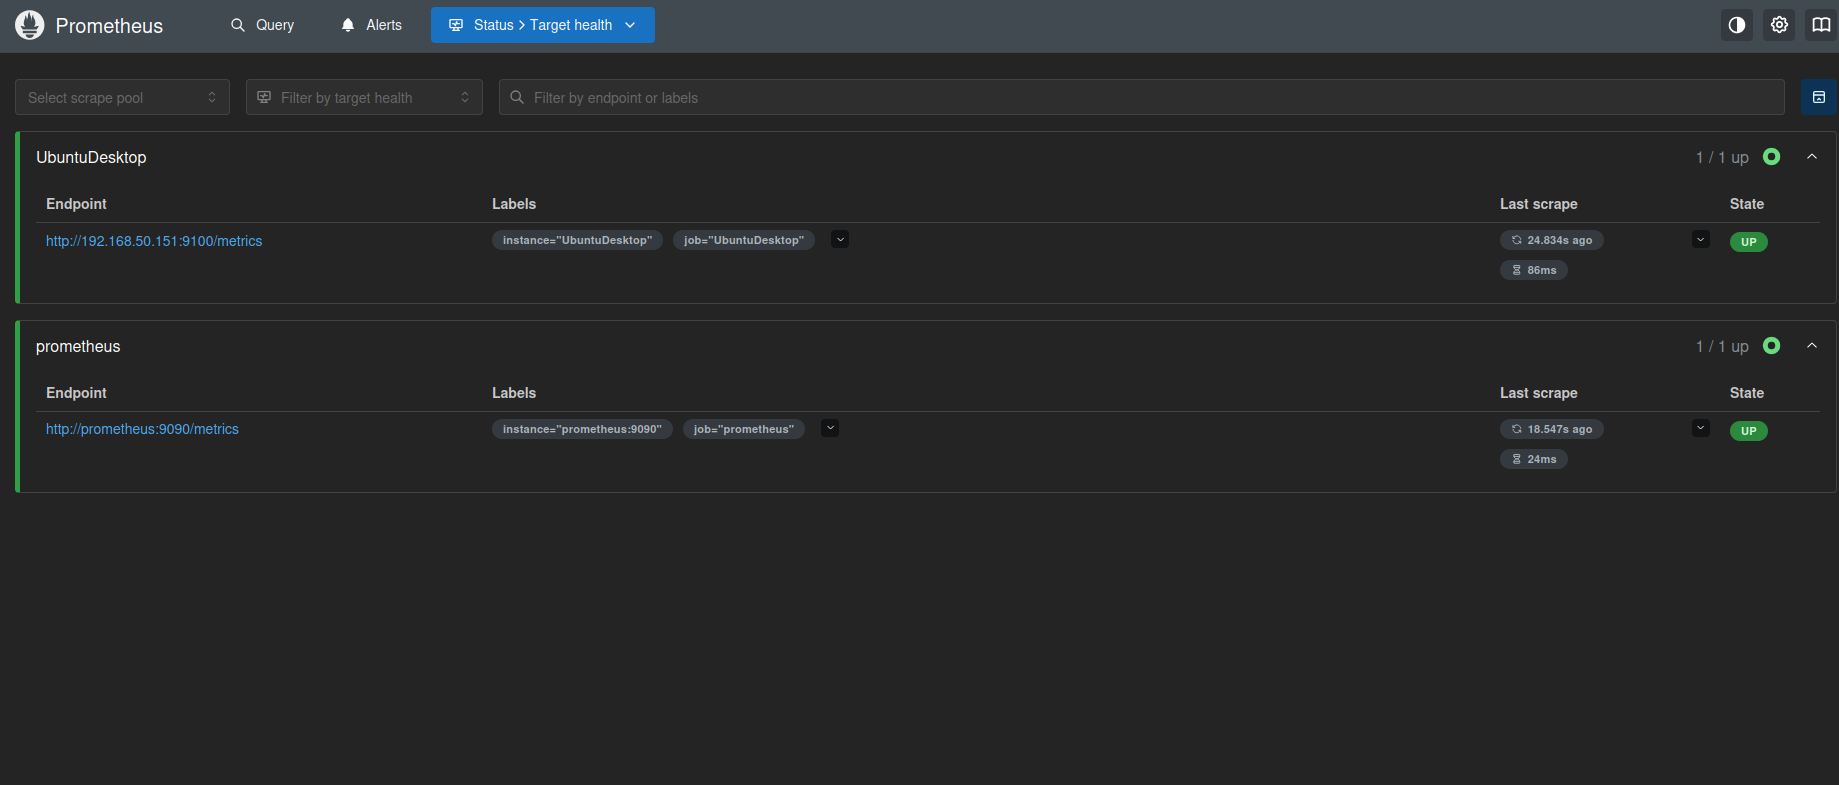 Awesome we can see some information health in there from our Ubuntu Desktop. So far so good. Let’s now try accessing the Grafana web console on port 3000.
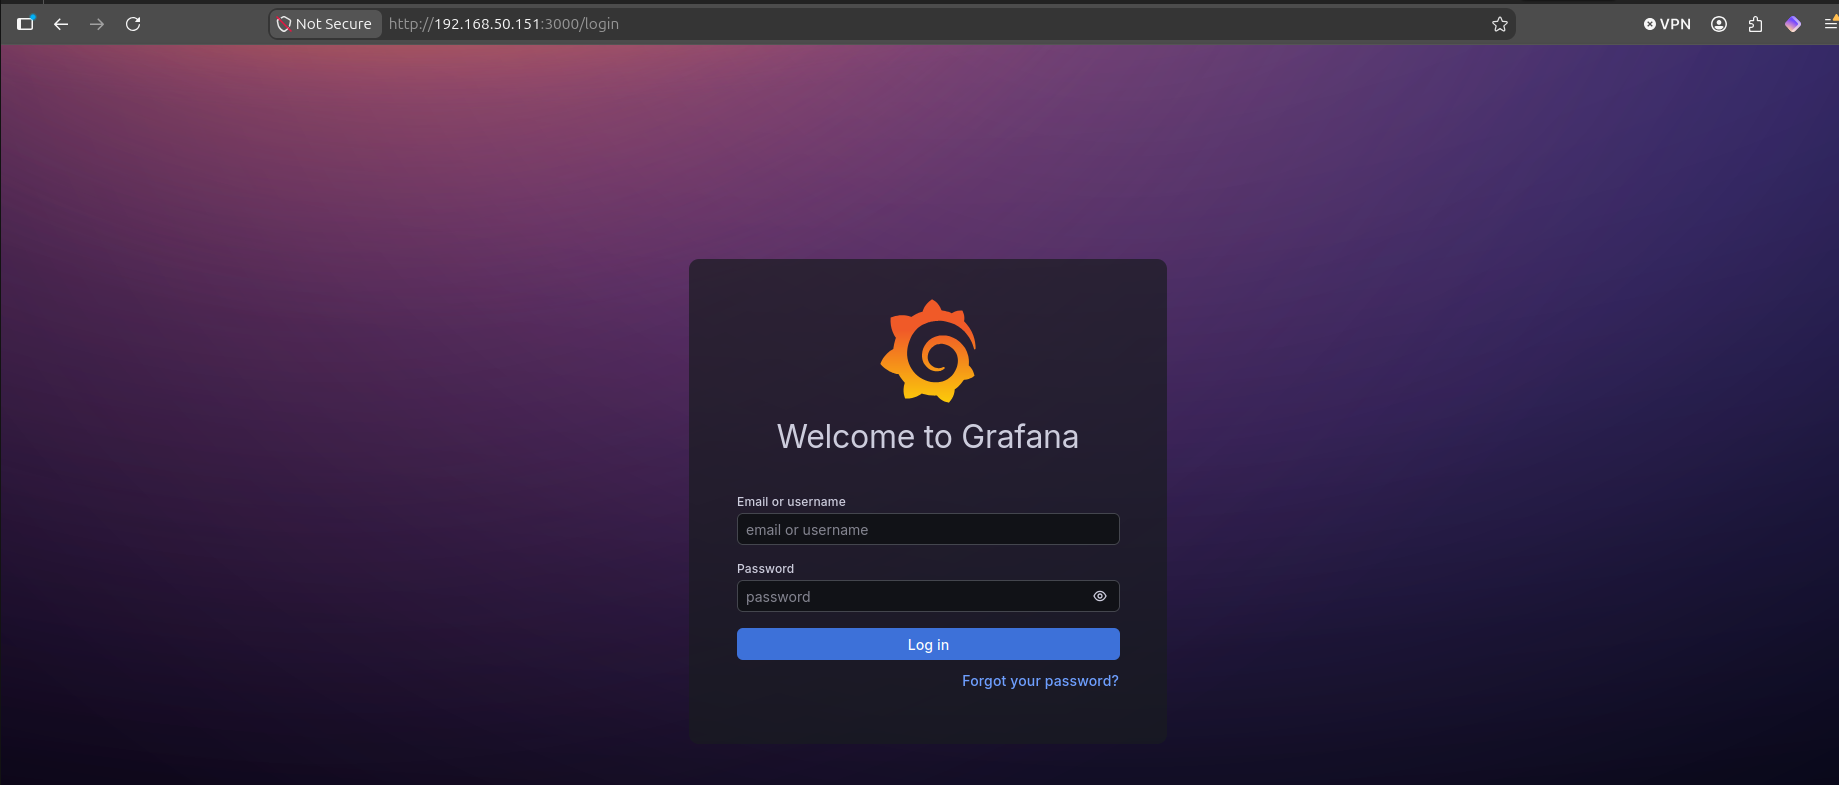 Oh yeah, looking nice. When you first login to Grafana the default creds are admin:admin. It will prompt us to change our password here after we first login.
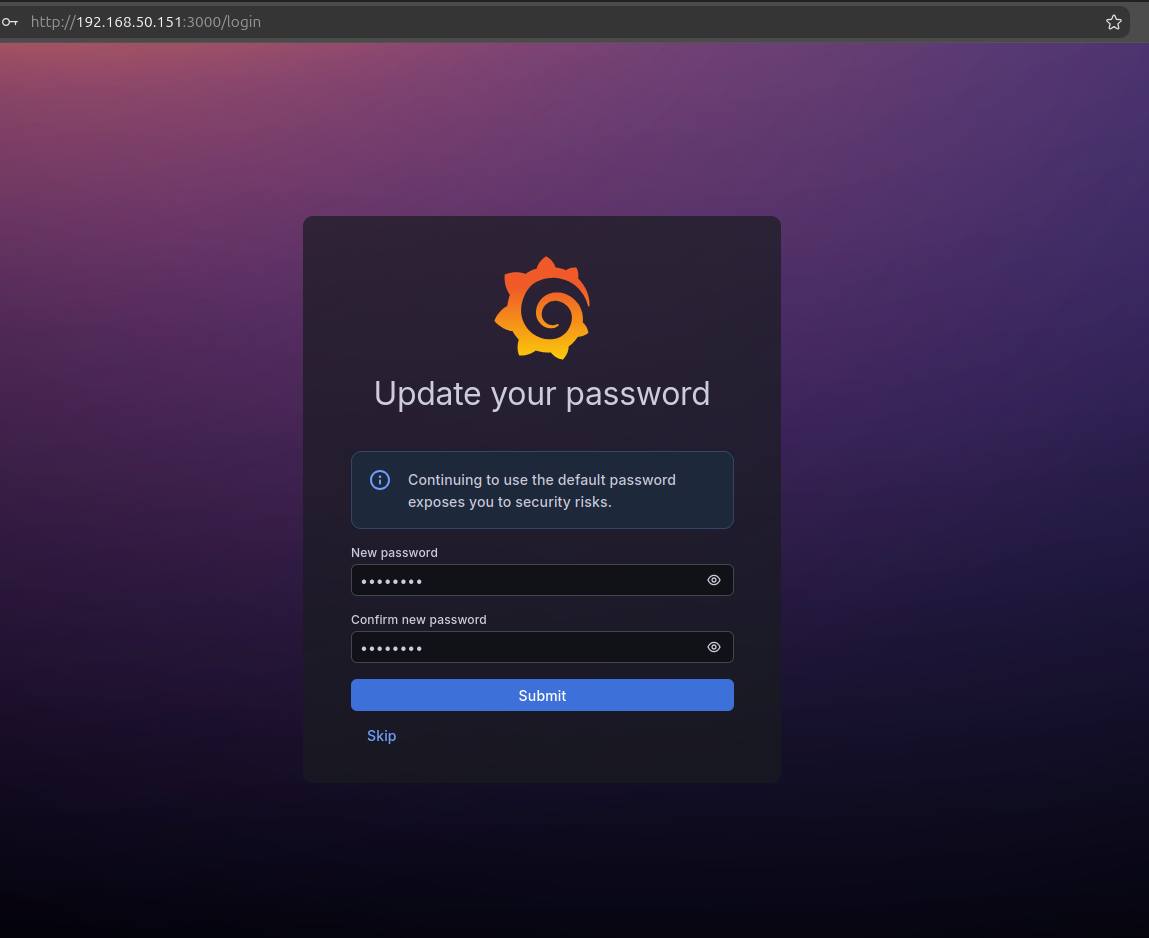 I changed mine here, make sure you change yours. And now after all that we should land on the Grafana home page.
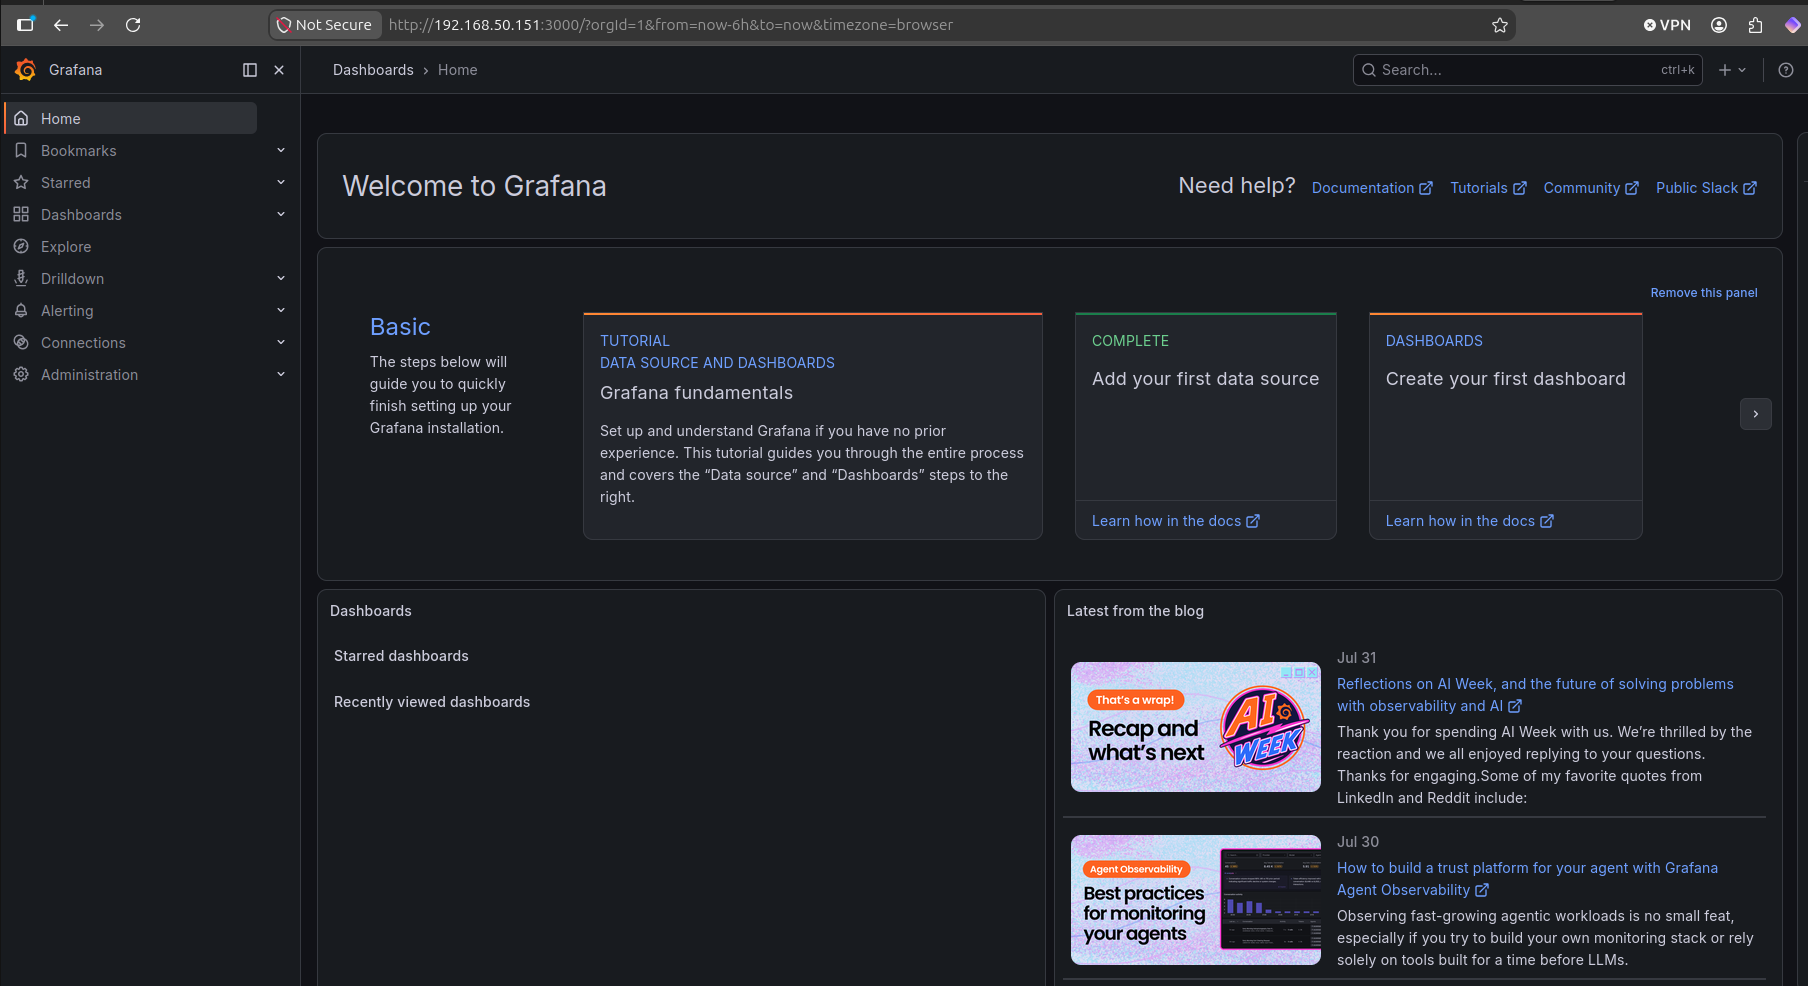 Amazing, we’re looking good so far. Next we’ve gotta have a way to actually visualize our data.
Creating Dashboard and Visualizing Data
Now it is time make our dashboard and make sure that our Ubuntu Desktop data is being properly ingested. On the lefthand menu click on Dashboards
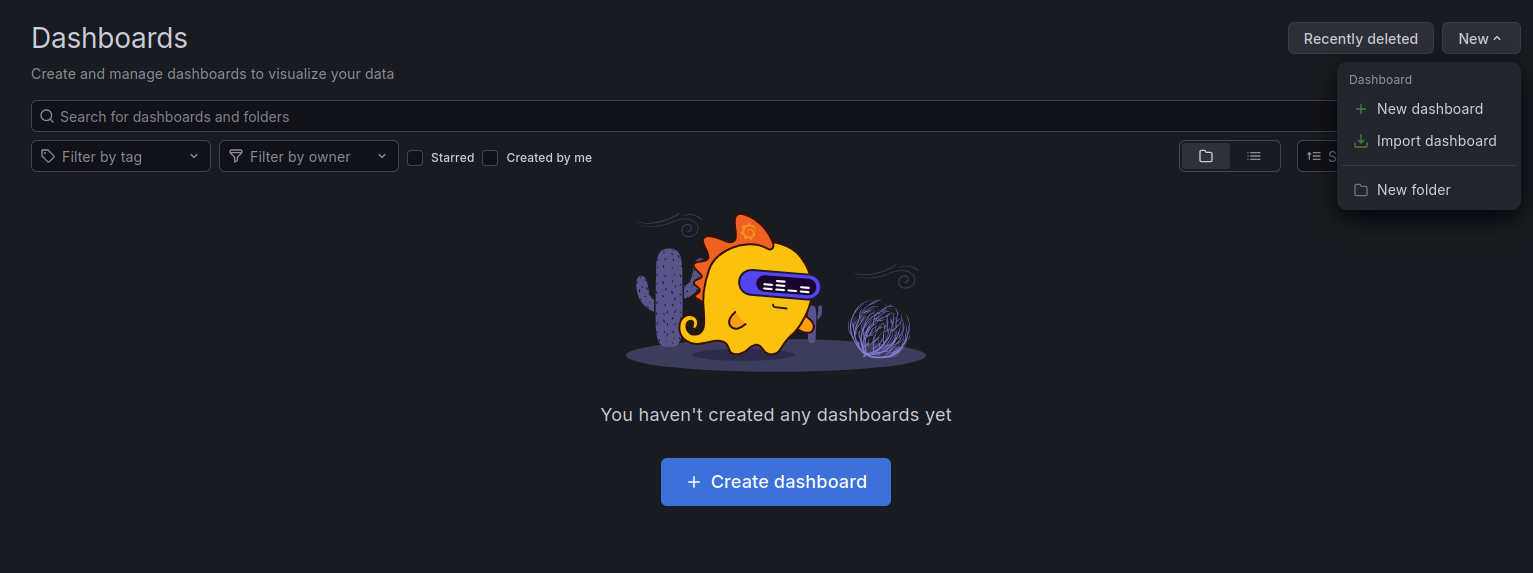
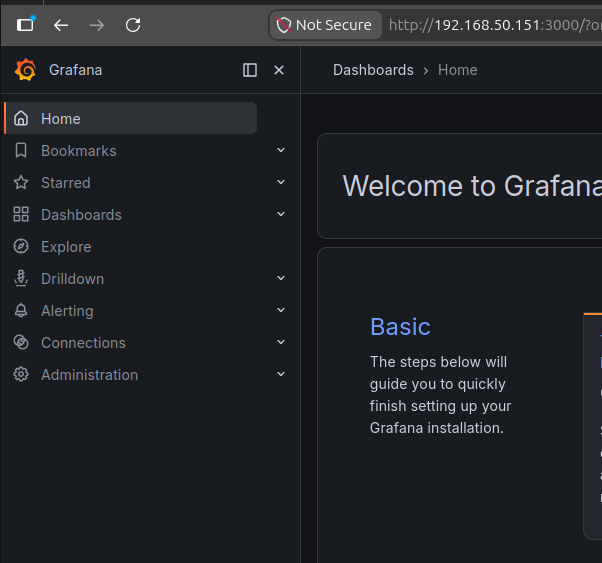 Alright, here on the Dashboards page we can see all of our Dashboards. Except that we haven’t made one yet. So we are going to click on New, but then we’re going to select Import dashboard as we will be using one of Grafana’s default Dashboards. Grafana is a lot like Kibana, where the sky is the limit with what you can do with Dashboards, so we will just be using a simple one to get us rolling.
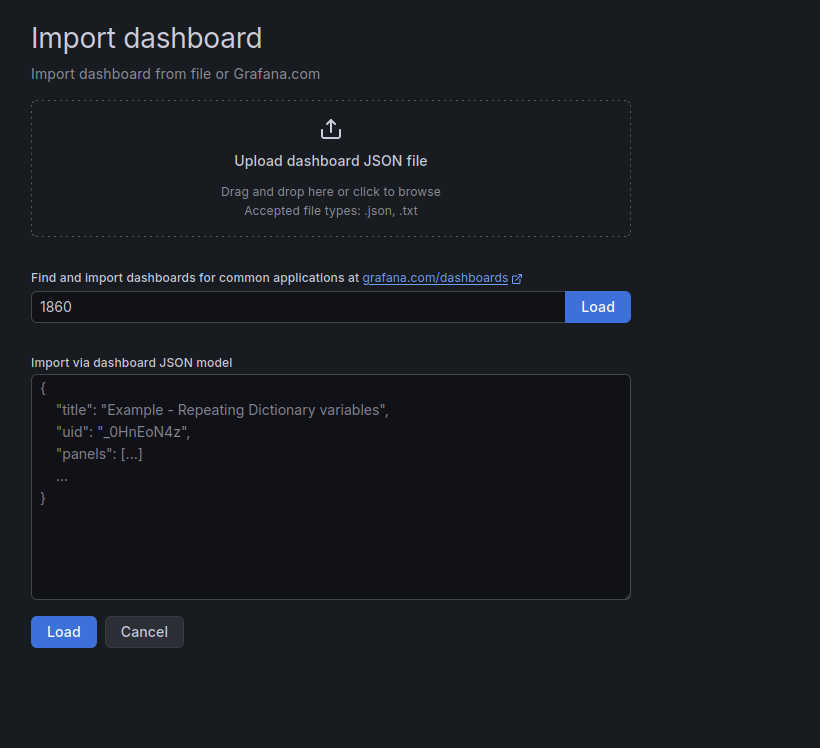
 After you click Import, we’re going to put 1860 in the Import dashboards field there. Go ahead and enter that and hit load.
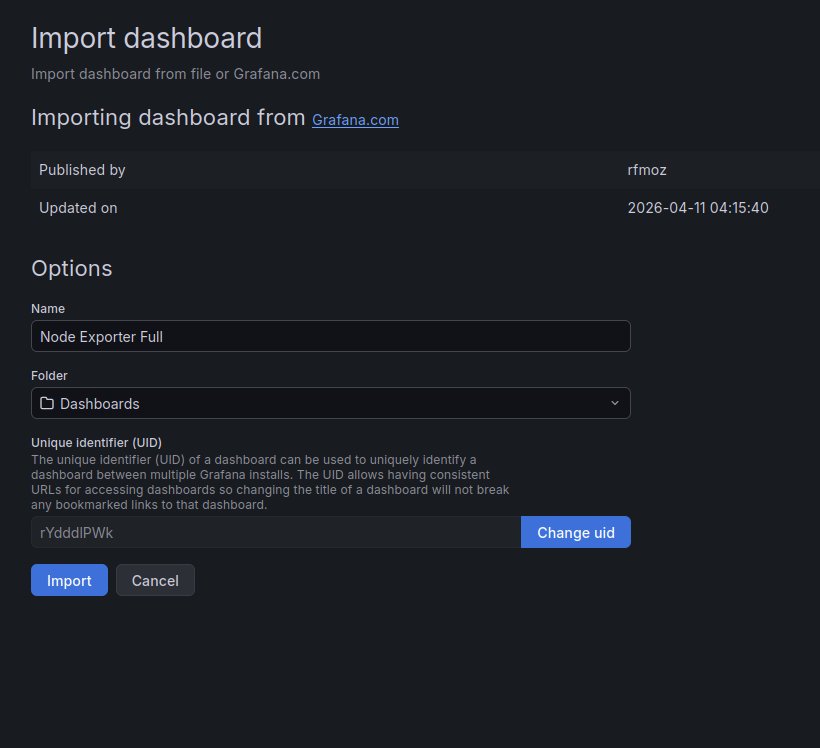
 Awesome, it recognizes the dashboard ID, just go ahead and hit Import.
 And there we go look at that we have our first dashboard with resource data being shown from our Ubuntu Desktop client!
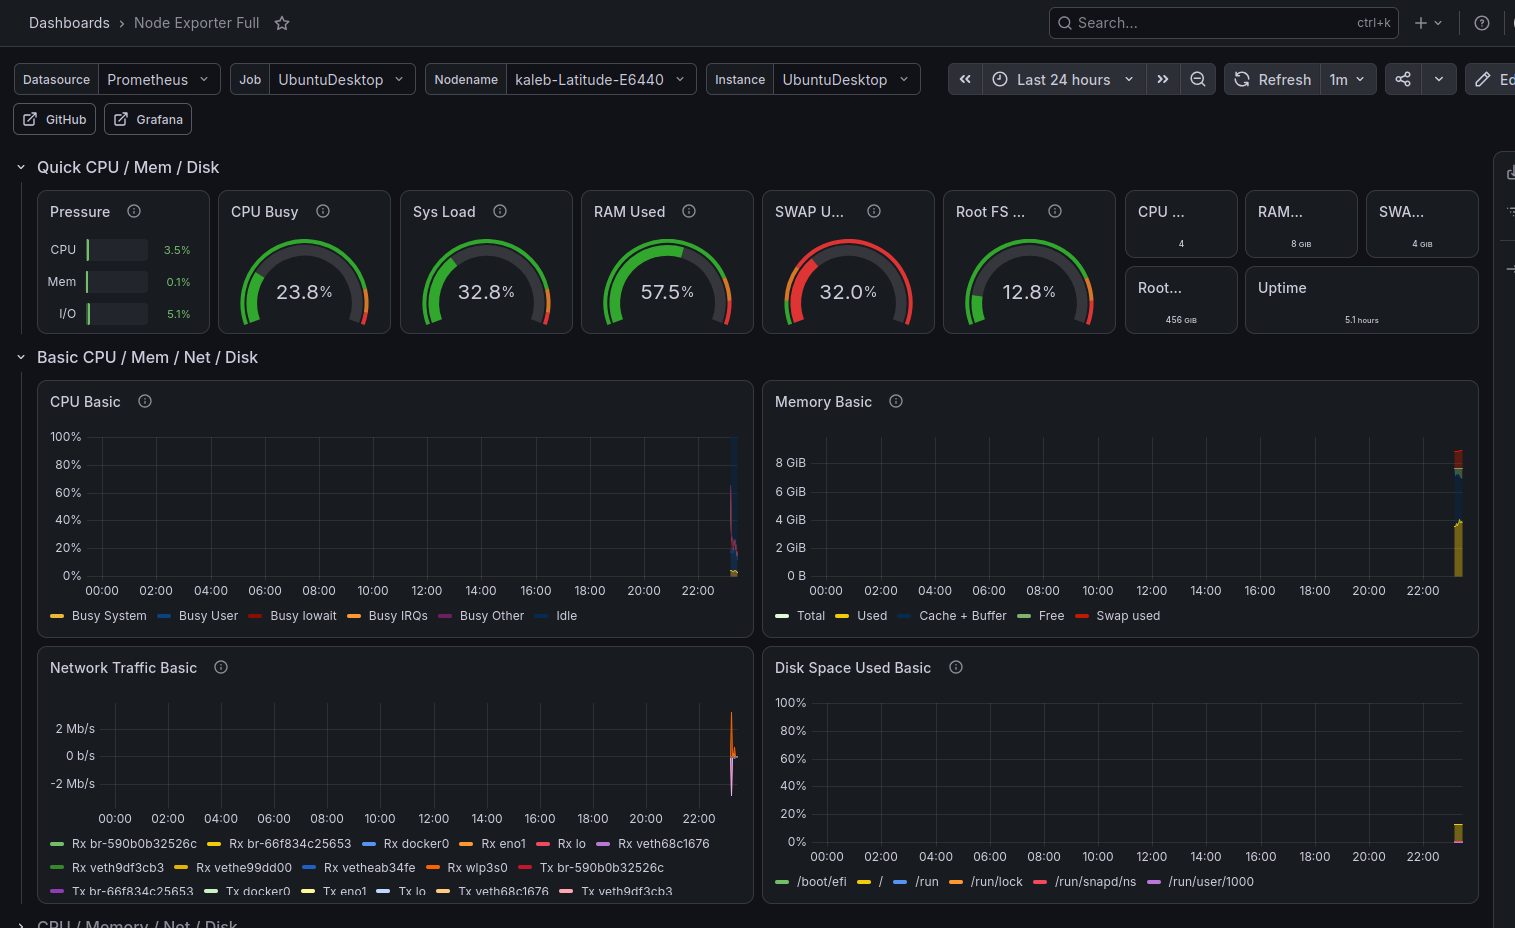 And look at that we have a simple Grafana dashboard going! Let’s add some of our other machines on our network!
Adding Other Hosts to Our Dashboard
Adding our Ubuntu Server
Alright so I think today we’ll add out Ubuntu Server machine and our Proxmox server. I don’t think we’ll be running a Prometheus collector on my Windows workstation, I’m not necessarily interested in having that kind of telemetry in Grafana. We will be setting up other monitoring tools for it later, this is more for our server workloads and whatnot.
Okey dokey, so on our Ubuntu Server machine let’s go ahead and make a directory for our Prometheus exporter container to live.
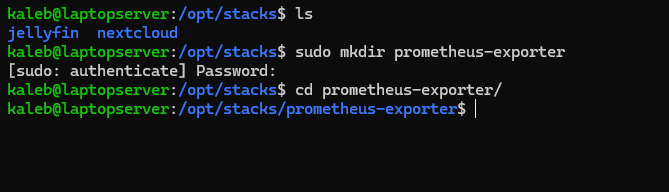 And a little compose file.

# Copy and Paste Away
services:
  node-exporter:
    image: quay.io/prometheus/node-exporter:latest
    container_name: node-exporter
    restart: unless-stopped
    command:
      - --path.rootfs=/host
    network_mode: host
    pid: host
    volumes:
      - /:/host:ro,rslave
    mem_limit: 128m
That should be that, so let’s get this container running.
 Okay, looking good, let’s see if the Prometheus container is responsive.
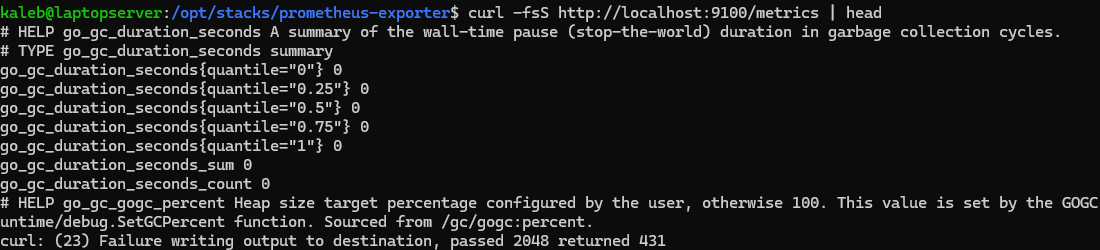 Okay, localhost works fine, but what about if we query that metrics endpoint from a remote system?
 Now, for me this did take a second to work, it was unresponsive for about a minute, but now we’re good. You may need to run
 docker compose up -d --force-recreate prometheus if it’s giving you a hard time. Alright, time to add our Ubuntu Server to the config on monitoring server.
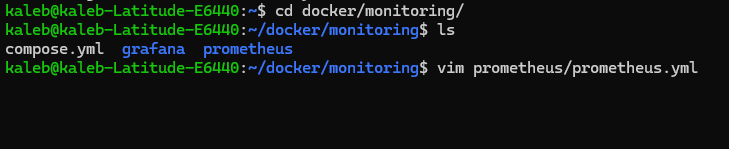 We’re going to add another section here under
 job_name. The target being the IP and port of where our Prometheus instance is running and we give it an appropriate label.
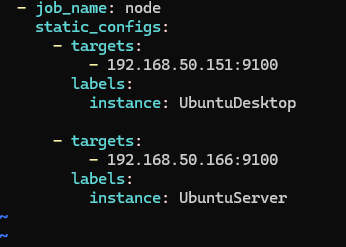 So we add our server’s IP and port as a target and give it the UbuntuServer label. Alright let’s reload Prometheus to update the config.
 Amazing. Let’s check the /targets endpoint to see if it’s up
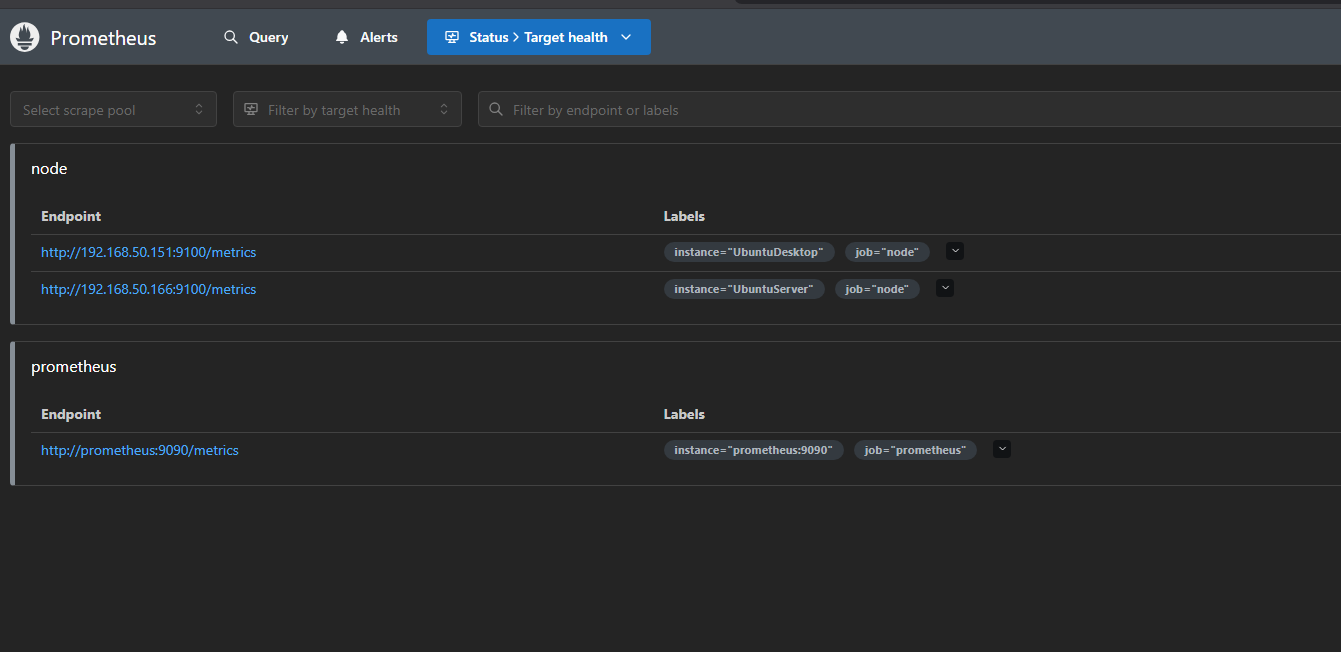 And look at that. Okay full disclosure, it wasn’t there at first, I had to force recreate the Prometheus container and then verify the YAML file for the container and the YAML file inside the container where the same because they weren’t so I couldn’t see it.
 So with that now fixed we should be able to see our Ubuntu Server in Grafana now.
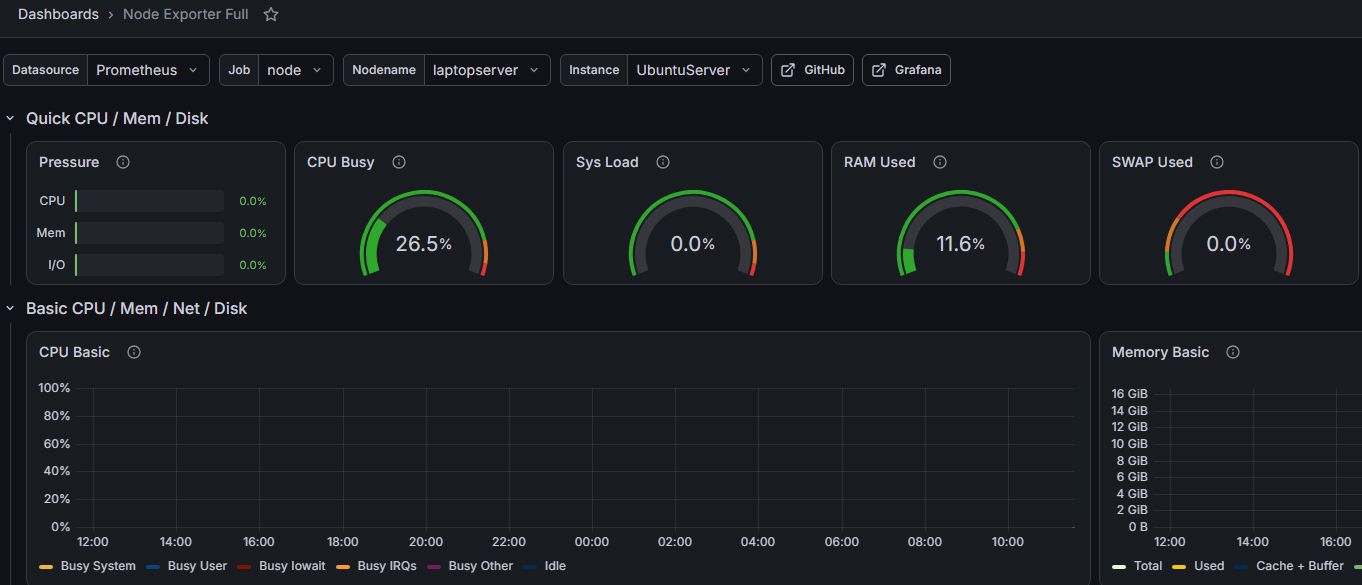 Awesome, let’s add the Proxmox server.
Adding Proxmox Server
We’re not gonna run Docker on our Proxmox box, so we’ll be just installing the package normally and going from there.
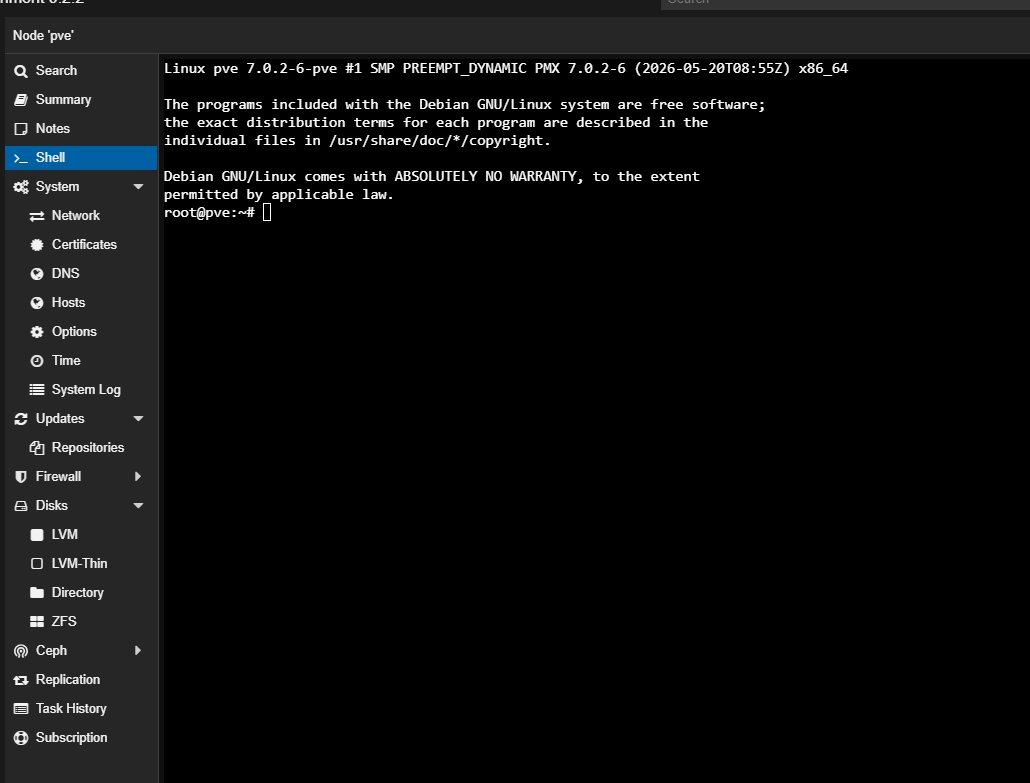 Okay, so we haven’t actually gotten to Proxmox yet in the series so feel free to comeback here later, I never promised this would all be exactly in order. But so let’s install our packages.
Run these commands.
Okay, so we haven’t actually gotten to Proxmox yet in the series so feel free to comeback here later, I never promised this would all be exactly in order. But so let’s install our packages.
Run these commands.
sudo apt update
sudo apt install prometheus-node-exporter
sudo systemctl enable --now prometheus-node-exporter
sudo systemctl status prometheus-node-exporter
curl -fsS http://localhost:9100/metrics | head
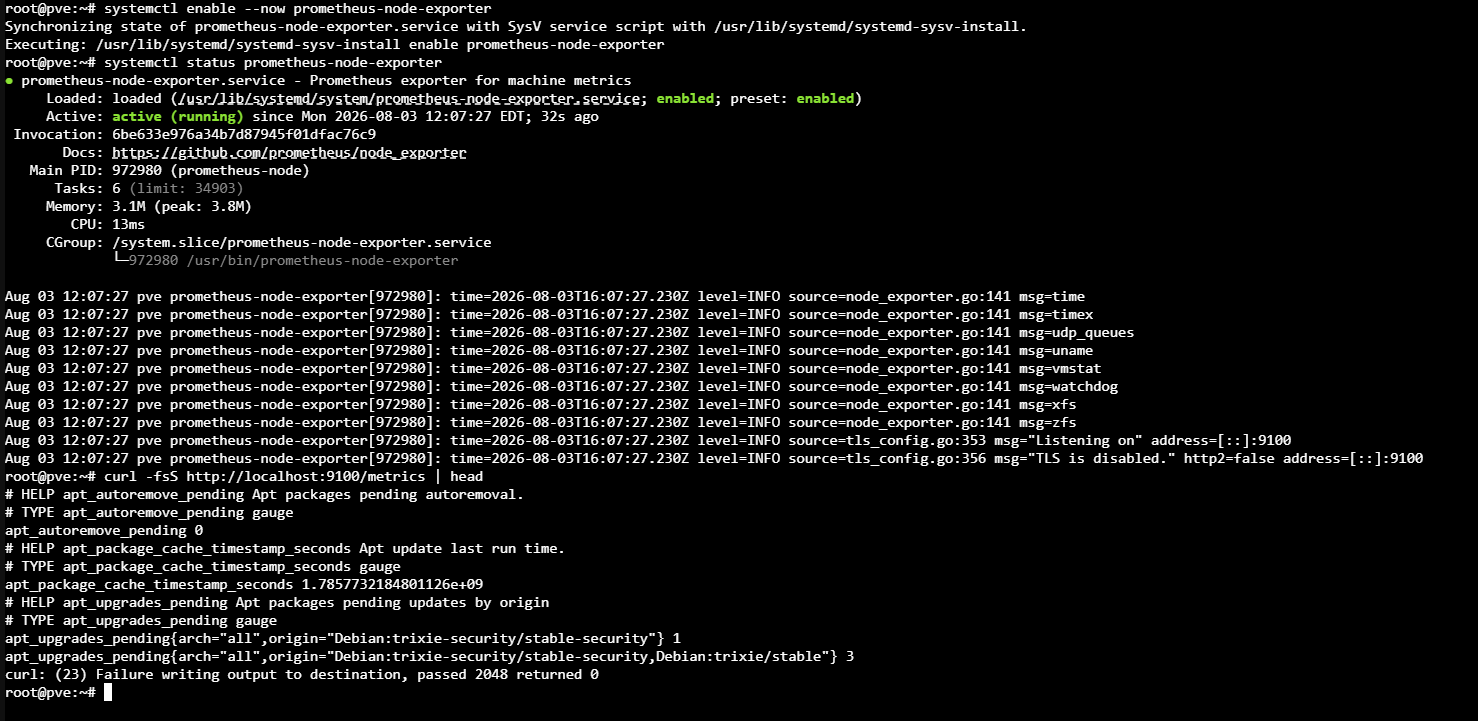 So after all those run and you curl localhost’s metrics endpoint that should be that. Back to the monitoring server to add our Proxmox server to the config.
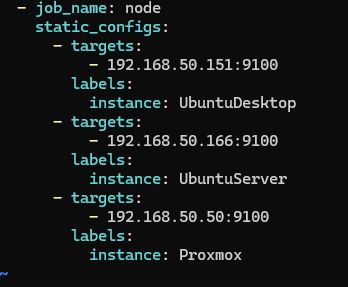 Okay time to recreate the container and verify the hash again.
 Okay very good, let’s check the targets endpoint.
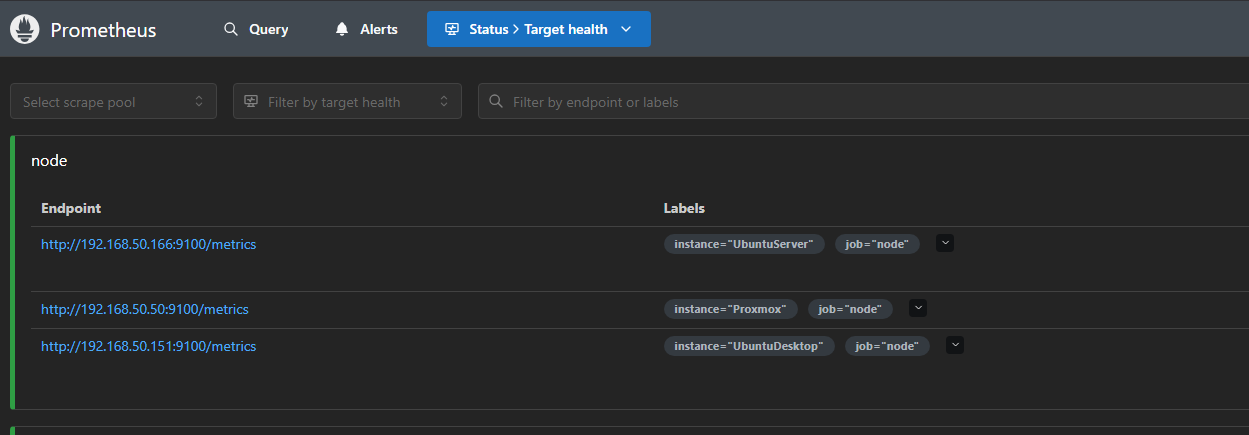 Ayo, and check Grafana.
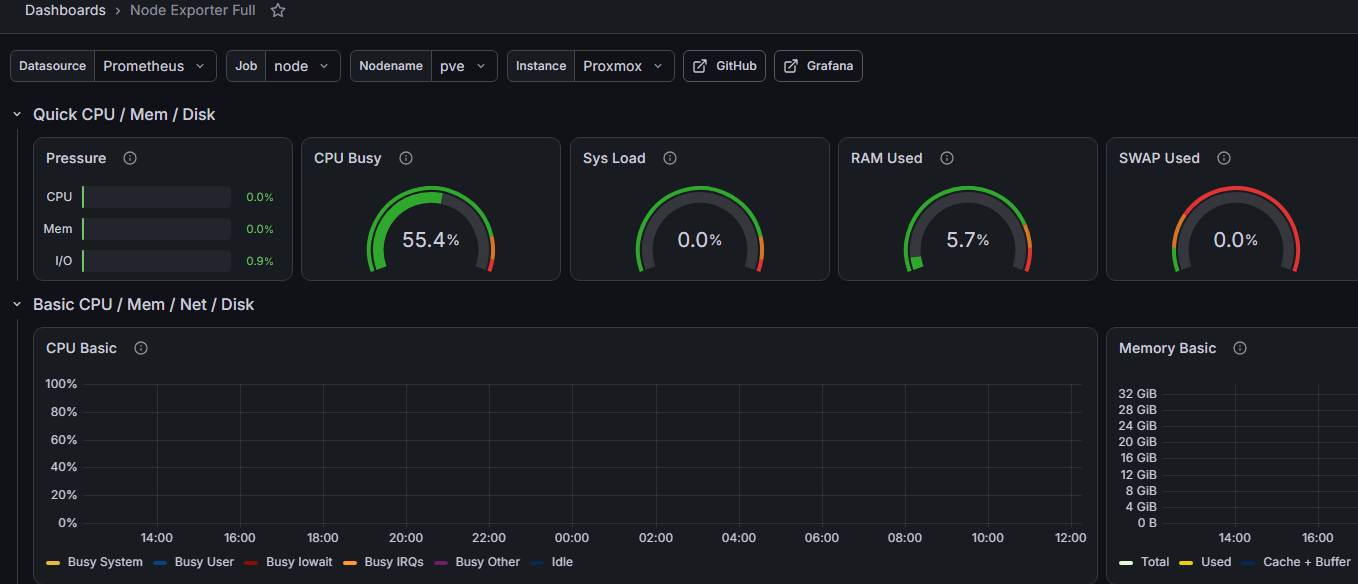 Very good. Now, time for Uptime Kuma
Uptime Kuma
Now to finish uptime Kuma
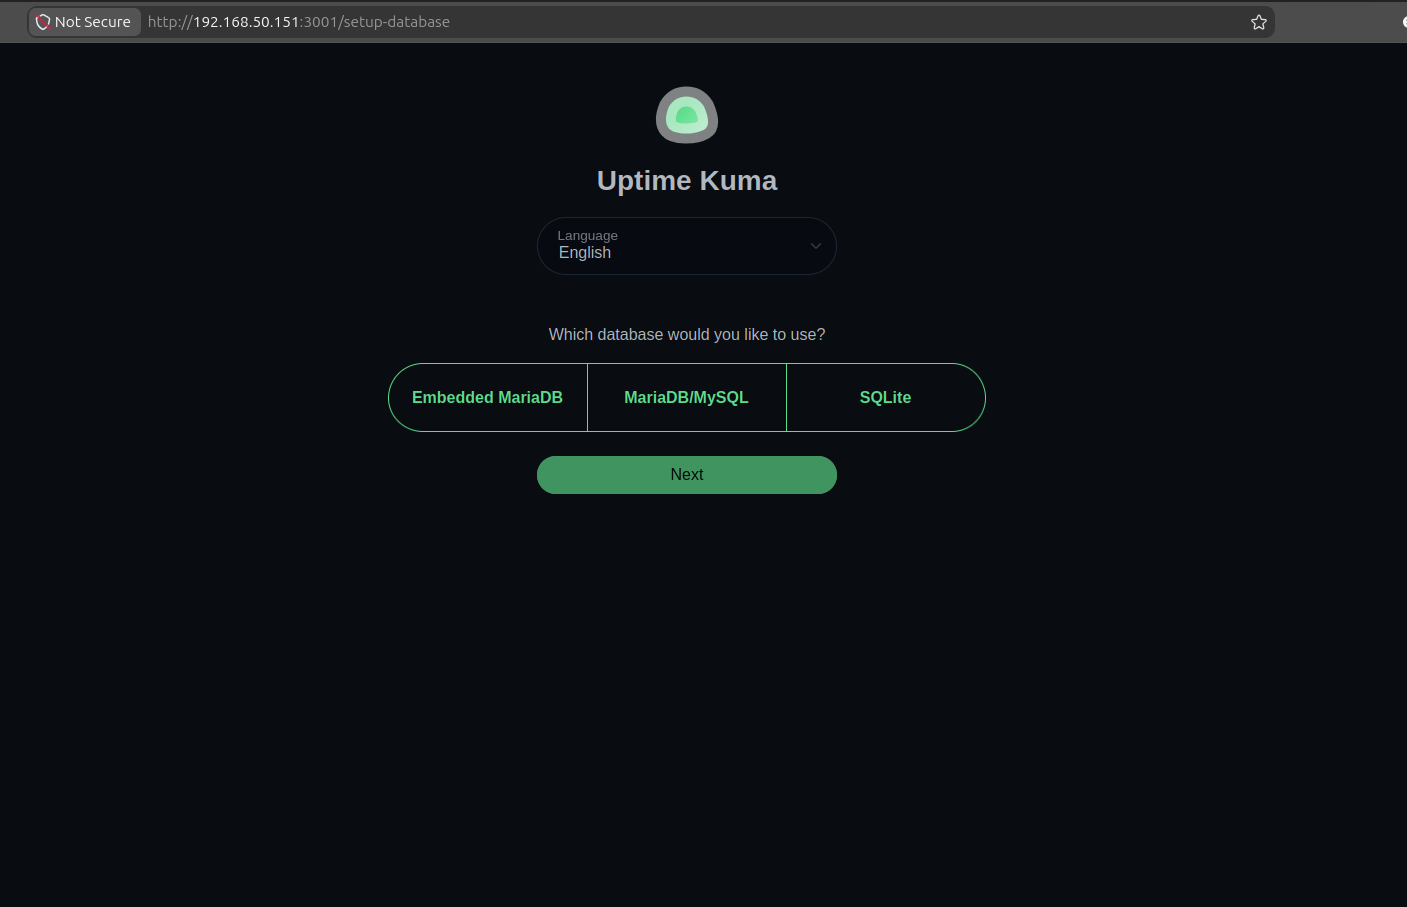 We’re choosing SQLite
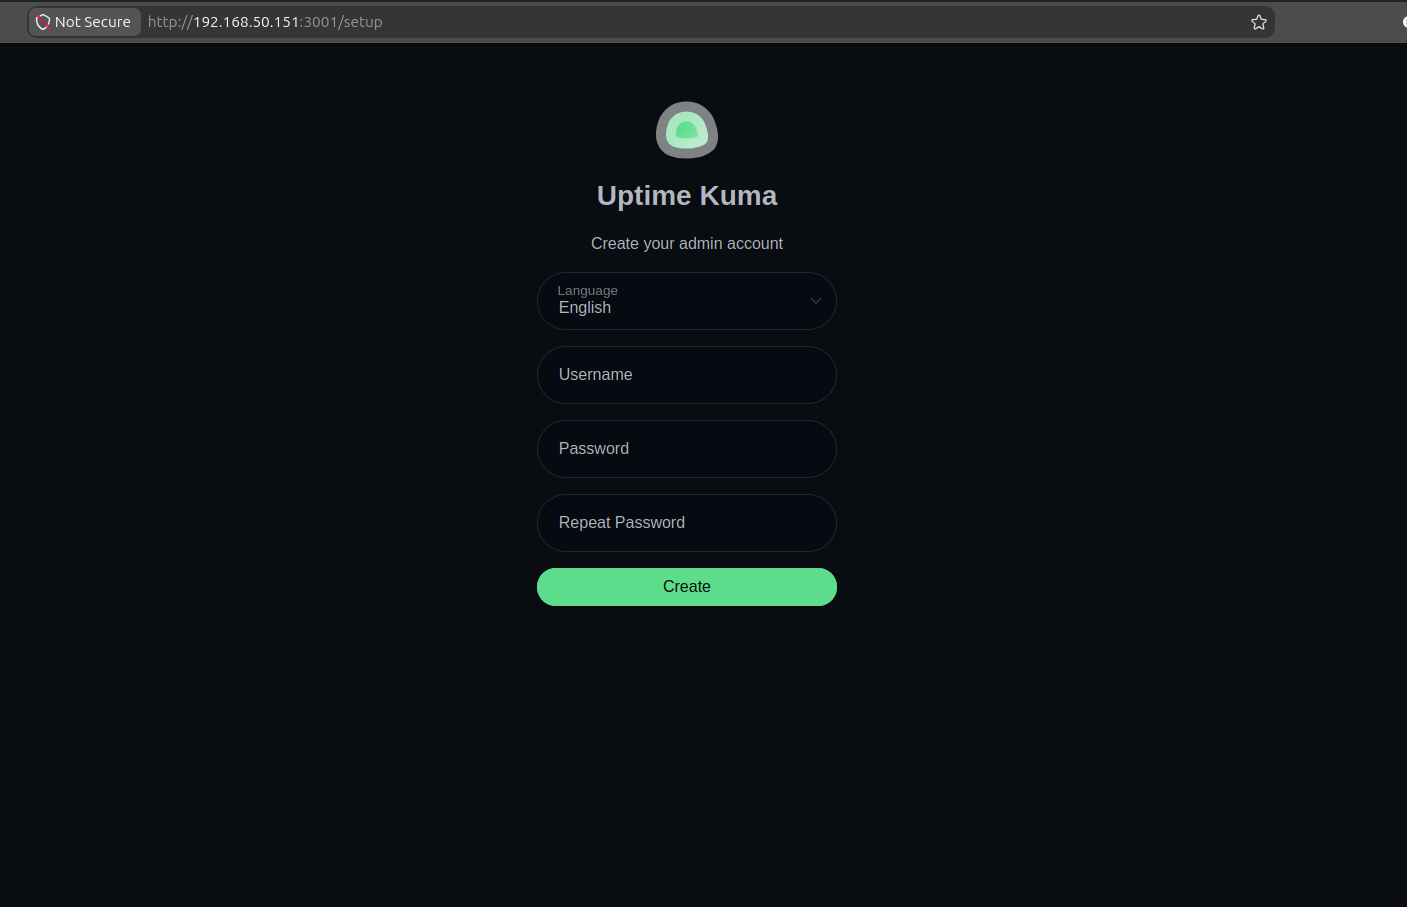 Make account
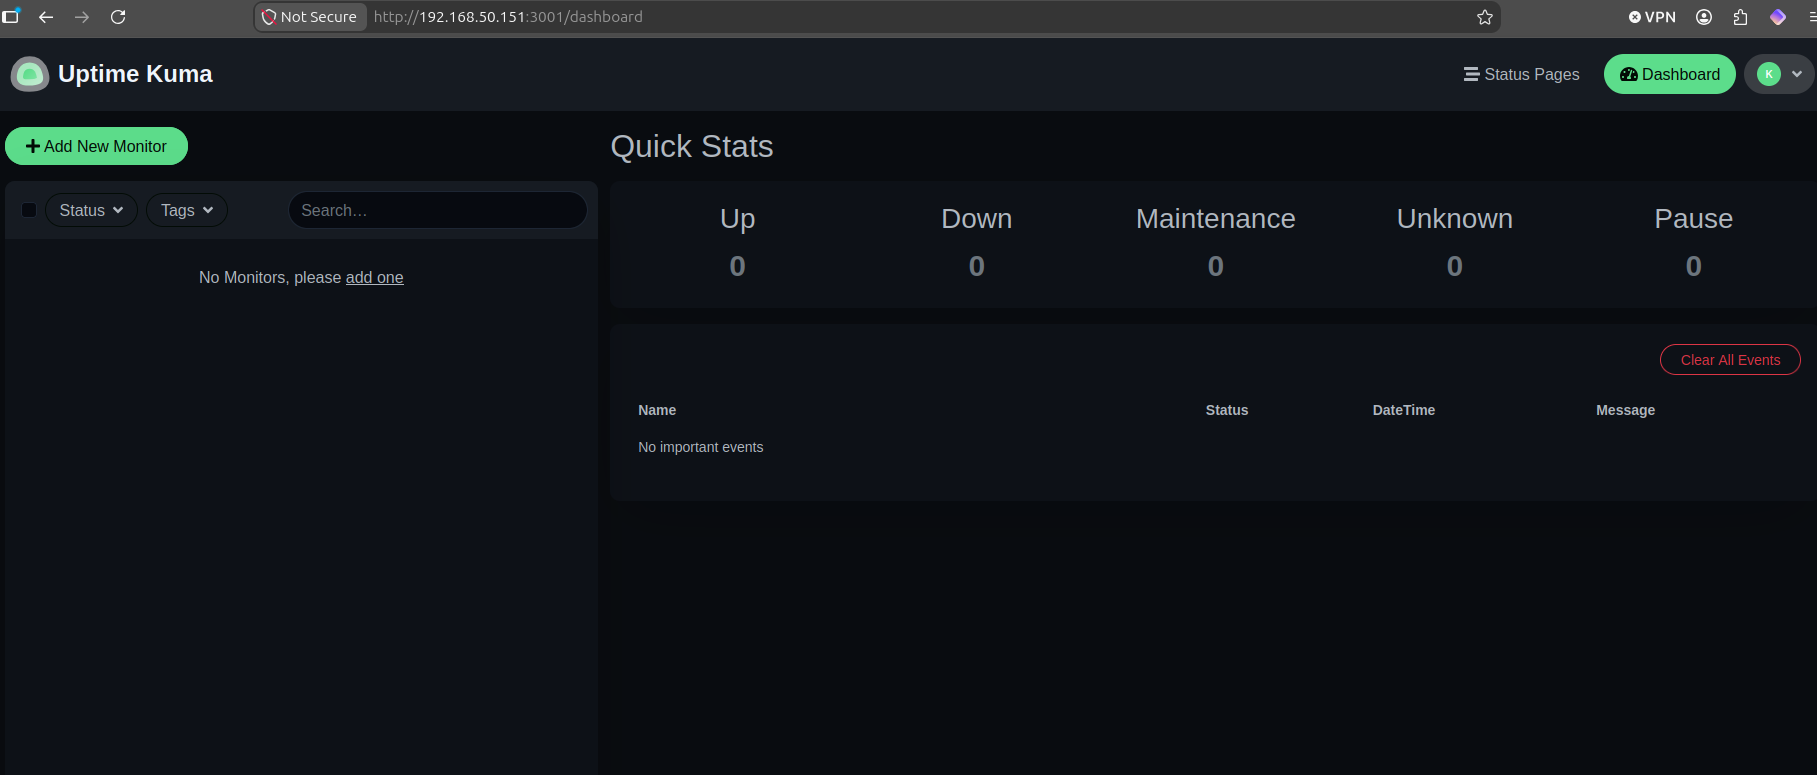 Alright, time to add a new Monitor, click Add New Monitor.
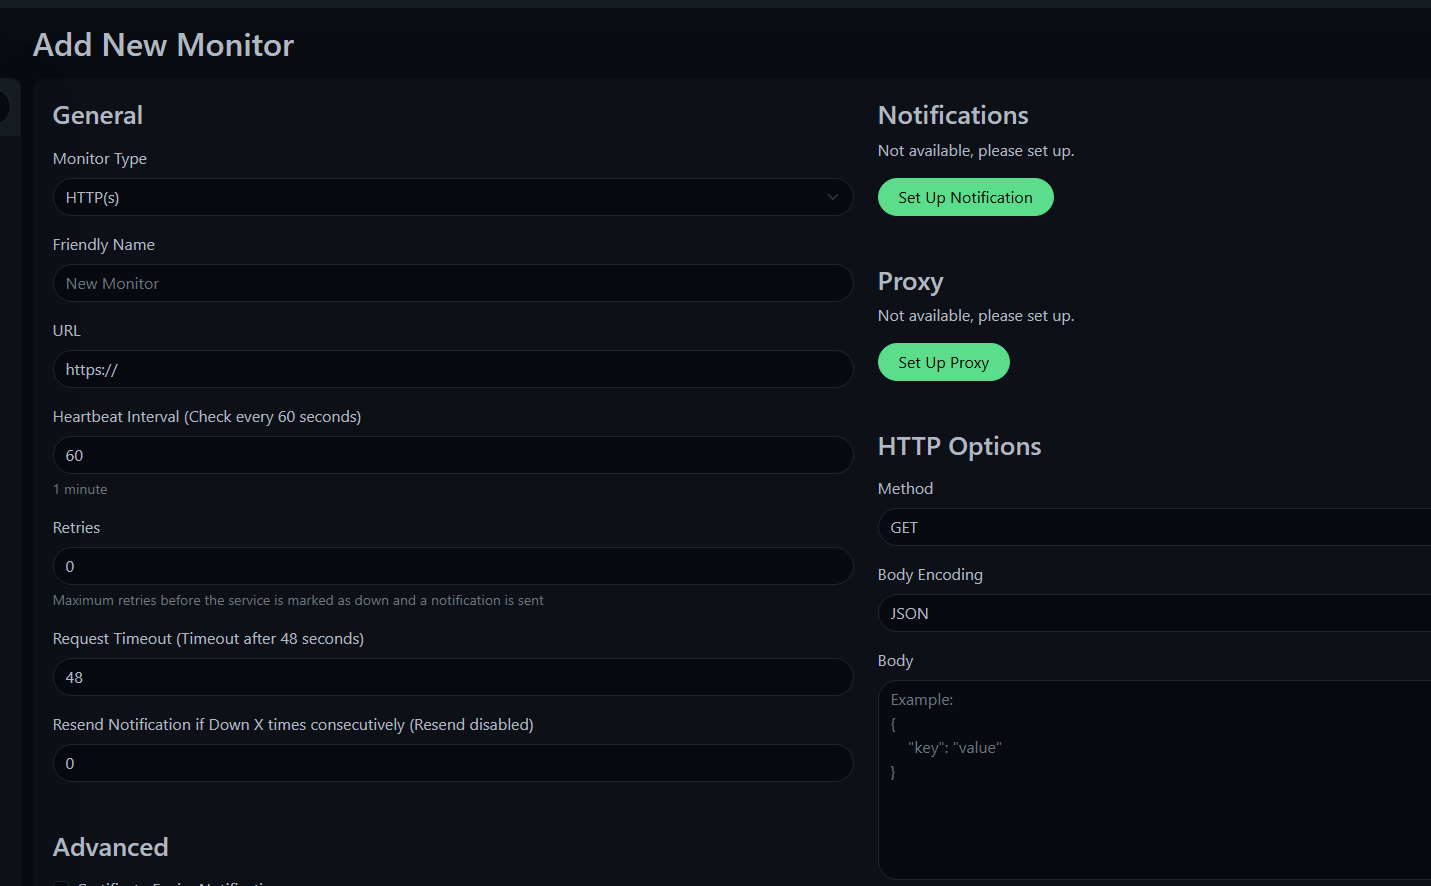 For our first monitor, let’s fittingly do a health check for the Grafana web GUI.
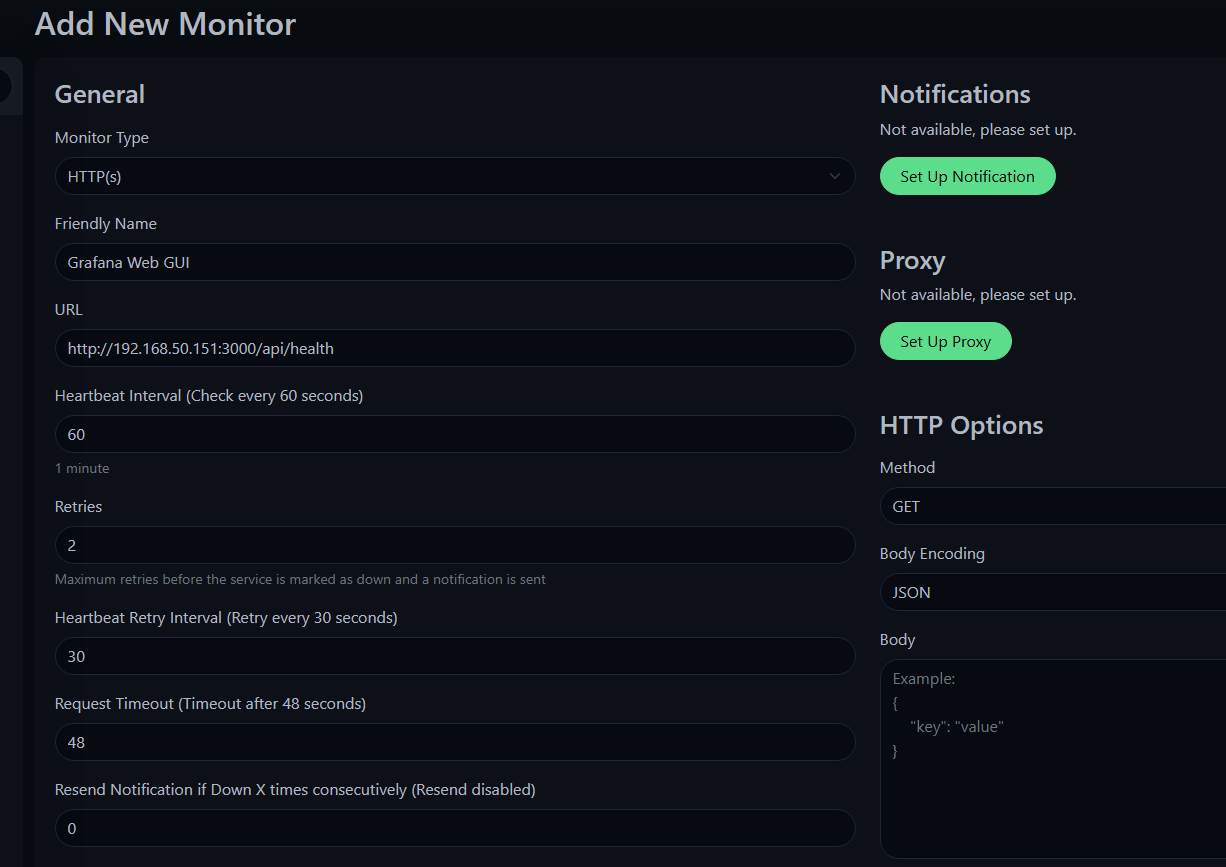 So here is the Monitor with the General information filled out. Let’s actually set up the Notification. Click on the Set Up Notification button.
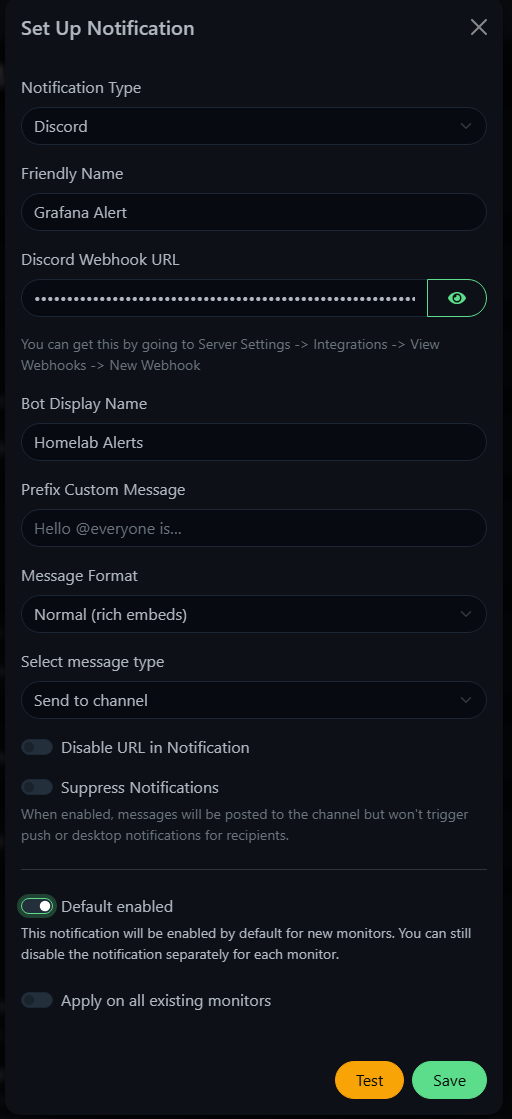 So I setup a webhook to just get pinged on Discord via a private channel whenever there’s an issue. Let’s test it!
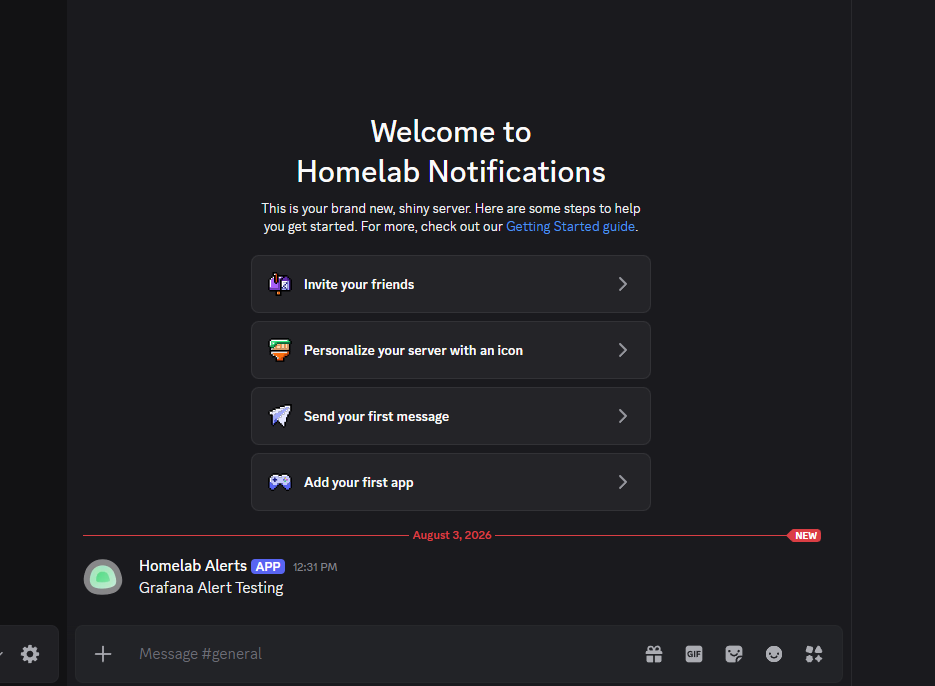 And look at that. Now I am personally going to do this for several service, but that concludes you needing to watch me do that.
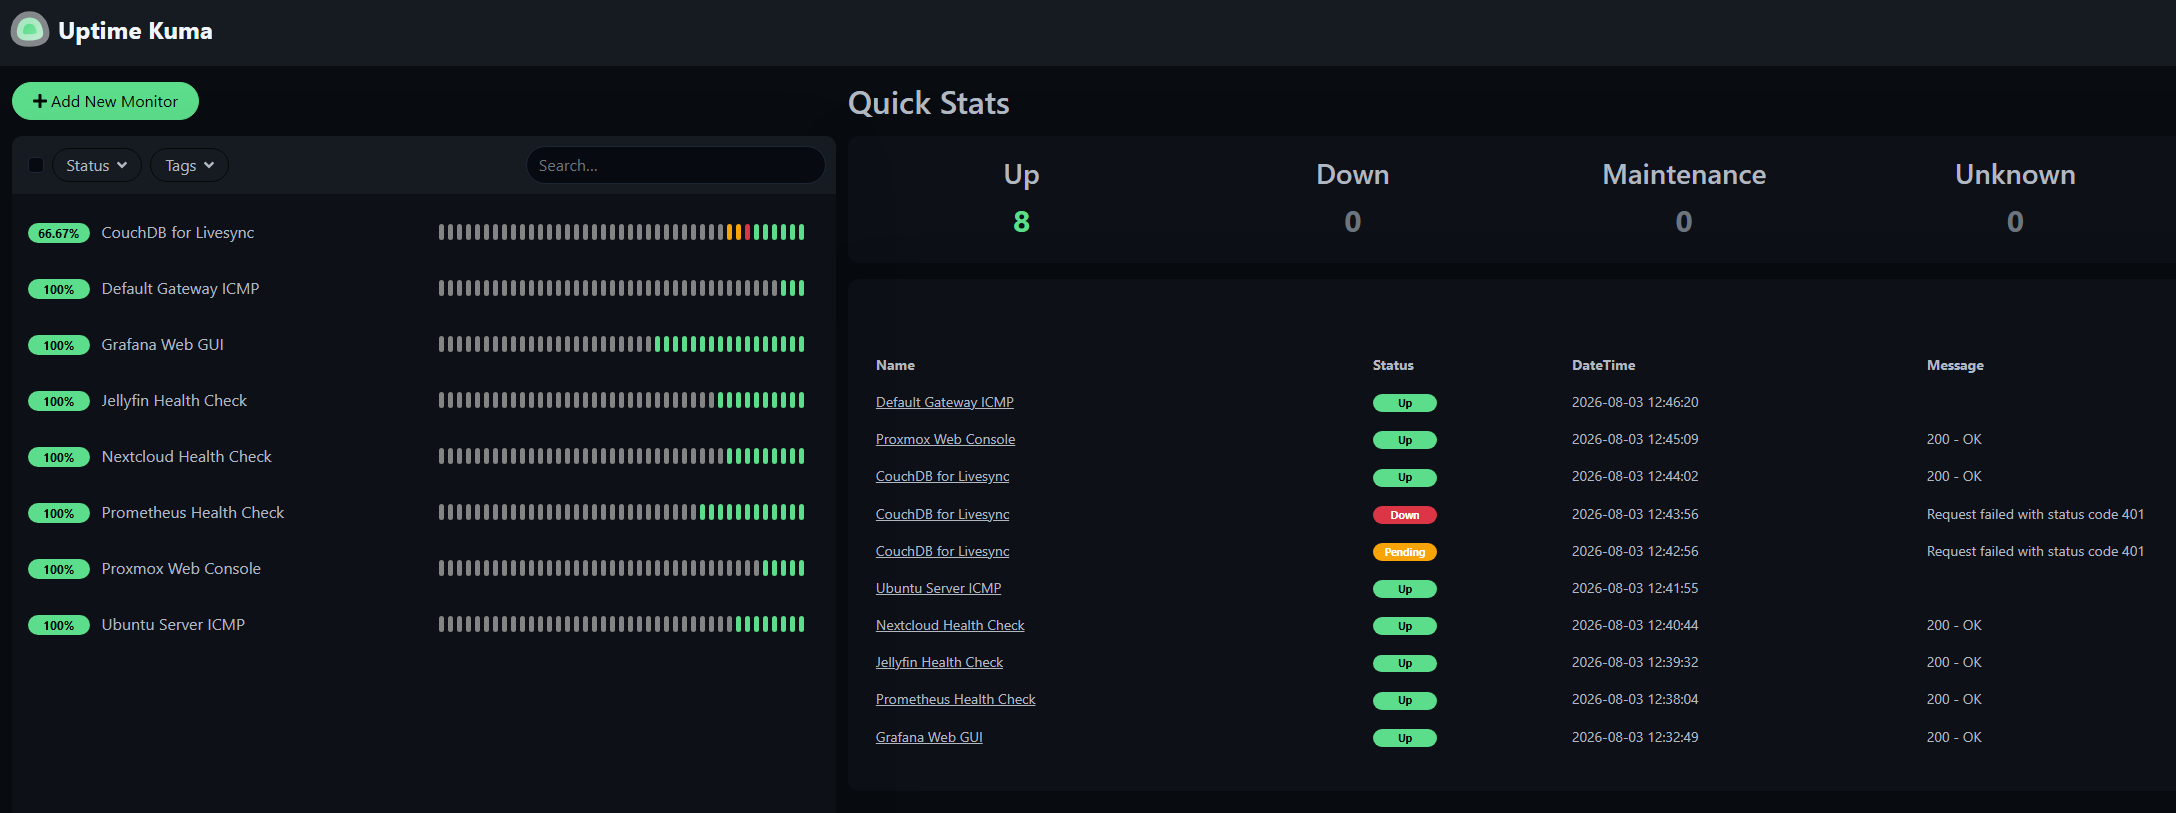 So here are all the monitors we have for right now. There will be many more to come, but that is all for now!